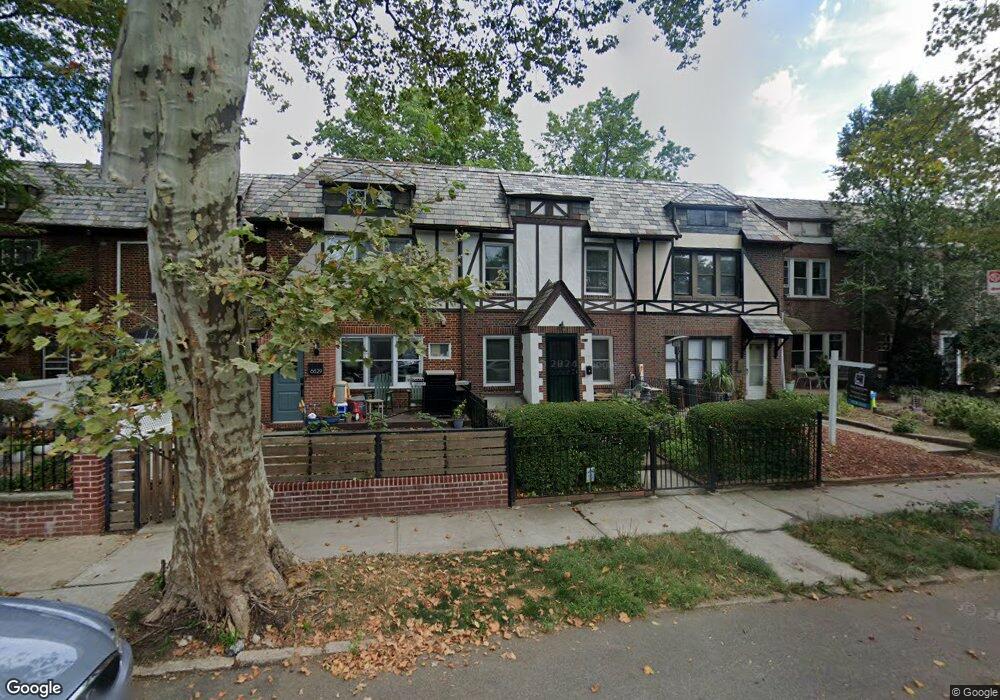
6829 Harrow St Forest Hills, NY 11375
Forest Hills NeighborhoodEstimated Value: $1,008,464 - $1,185,000
--
Bed
--
Bath
1,152
Sq Ft
$973/Sq Ft
Est. Value
About This Home
This home is located at 6829 Harrow St, Forest Hills, NY 11375 and is currently estimated at $1,120,866, approximately $972 per square foot. 6829 Harrow St is a home located in Queens County with nearby schools including Ps 144 Col Jeromus Remsen, J.H.S. 190 Russell Sage, and Queens Metropolitan High School.
Ownership History
Date
Name
Owned For
Owner Type
Purchase Details
Closed on
Sep 10, 2018
Sold by
Chen Shuming
Bought by
Collins Mccormick Terence and Myers Mccormick Claire
Current Estimated Value
Home Financials for this Owner
Home Financials are based on the most recent Mortgage that was taken out on this home.
Original Mortgage
$799,200
Outstanding Balance
$695,514
Interest Rate
4.5%
Mortgage Type
Purchase Money Mortgage
Estimated Equity
$425,352
Purchase Details
Closed on
Oct 27, 2015
Sold by
Doreen Malone As Trustee
Bought by
Chen Shuming
Home Financials for this Owner
Home Financials are based on the most recent Mortgage that was taken out on this home.
Original Mortgage
$535,000
Interest Rate
3.87%
Purchase Details
Closed on
Oct 21, 2011
Sold by
Robert Stidolph As Executor
Bought by
Dorothy Malone As Trustee and Robert Stidolph, As Trustee
Create a Home Valuation Report for This Property
The Home Valuation Report is an in-depth analysis detailing your home's value as well as a comparison with similar homes in the area
Home Values in the Area
Average Home Value in this Area
Purchase History
| Date | Buyer | Sale Price | Title Company |
|---|---|---|---|
| Collins Mccormick Terence | $999,000 | -- | |
| Chen Shuming | $735,000 | -- | |
| Dorothy Malone As Trustee | -- | -- |
Source: Public Records
Mortgage History
| Date | Status | Borrower | Loan Amount |
|---|---|---|---|
| Open | Collins Mccormick Terence | $799,200 | |
| Previous Owner | Chen Shuming | $535,000 |
Source: Public Records
Tax History Compared to Growth
Tax History
| Year | Tax Paid | Tax Assessment Tax Assessment Total Assessment is a certain percentage of the fair market value that is determined by local assessors to be the total taxable value of land and additions on the property. | Land | Improvement |
|---|---|---|---|---|
| 2025 | $9,598 | $48,896 | $8,862 | $40,034 |
| 2024 | $9,598 | $47,785 | $9,854 | $37,931 |
| 2023 | $9,166 | $45,635 | $8,657 | $36,978 |
| 2022 | $8,624 | $66,120 | $11,940 | $54,180 |
| 2021 | $8,576 | $62,460 | $11,940 | $50,520 |
| 2020 | $8,625 | $61,260 | $11,940 | $49,320 |
| 2019 | $8,330 | $59,940 | $11,940 | $48,000 |
| 2018 | $7,752 | $38,029 | $8,371 | $29,658 |
| 2017 | $7,387 | $36,237 | $8,232 | $28,005 |
| 2016 | $5,945 | $36,237 | $8,232 | $28,005 |
| 2015 | $3,547 | $29,733 | $8,773 | $20,960 |
| 2014 | $3,547 | $28,962 | $9,668 | $19,294 |
Source: Public Records
Map
Nearby Homes
- 6836 Groton St
- 94-11 69th Ave Unit 102
- 94-11 69th Ave Unit 307
- 68-37 Kessel St
- 6828 Kessel St
- 67-31 Ingram St
- 6915 Loubet St
- 91-11 68th Ave
- 69-55 Kessel St
- 67-54 Groton St
- 7285 Yellowstone Blvd
- 7267 Yellowstone Blvd
- 72-89 Yellowstone Blvd
- 67-49 Groton St
- 67-60 Exeter St
- 66-92 Selfridge St Unit 3J
- 66-92 Selfridge St Unit 1E
- 66-92 Selfridge St Unit 3E
- 68-11 Dartmouth St
- 90-01 68th Ave
- 6827 Harrow St
- 6831 Harrow St
- 6833 Harrow St
- 6825 Harrow St
- 6825 Harrow St
- 6835 Harrow St
- 6835 Harrow St
- 68-35 Harrow St
- 6823 Harrow St
- 6837 Harrow St
- 6837 Harrow St
- 68-21 Harrow St Unit House
- 68-21 Harrow St
- 6821 Harrow St
- 6839 Harrow St
- 6819 Harrow St
- 68-19 Harrow St Unit House
- 68-19 Harrow St
- 68-39 Harrow St
- 6830 Groton St