
Seller's Agent in 2023
Kathy Boyce
RE/MAX Real Estate Prof
(812) 371-7558
34 in this area
50 Total Sales


Estimated Value: $363,000 - $402,000
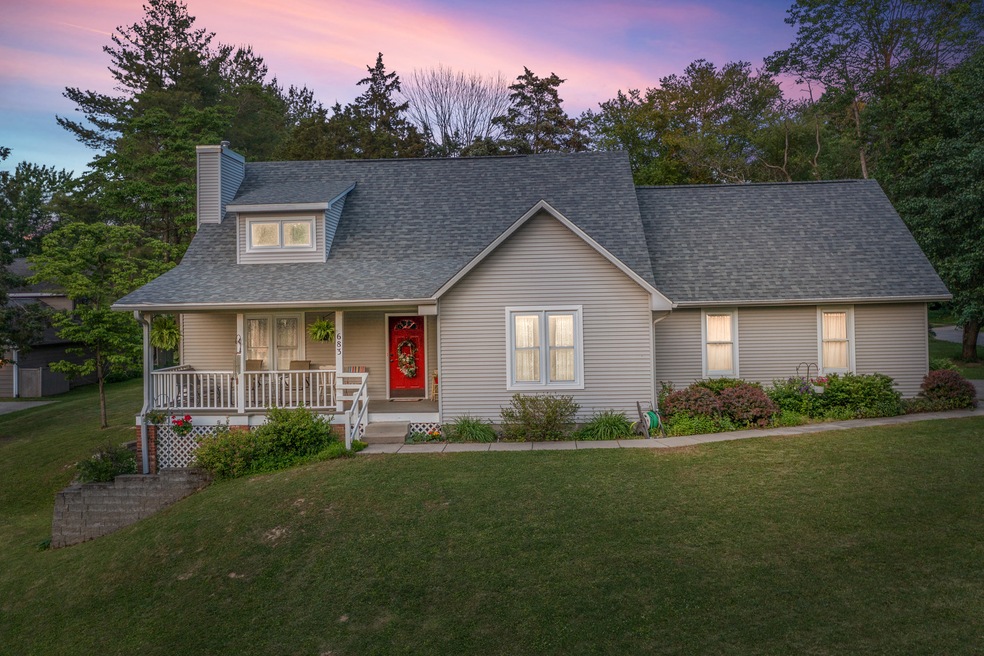
Charming Cape Cod! Tipton Lakes / Harrison Ridge! Southside School District! Features Include: Kitchen with Hardwood Floors, Great Room / Dining Room Combo with Vaulted Ceilings and Cozy Gas Log Fireplace! Primary Bedroom Main Level, 2 Bedrooms Upper Level with Full Bath and Walk-in Closets! Walk-out Basement and Fenced Back Yard. Updates Include: 2015: Roof, 2016: HVAC, Fence, Electric Range, Refrigerator, Washer & Dryer, 2017: Tile & Toilets (3 Bathrooms) 2020: New Windows (Eight), 2022: Dishwasher, Trees Removed, 2023: New Patio Doors (Main & Lower Level) This Home Has Everything on Your Checklist! Schedule Your Showing Today!!!
Last Agent to Sell the Property
RE/MAX Real Estate Prof License #RB14047910 Listed on: 05/27/2023
| Date | Buyer | Sale Price | Title Company |
|---|---|---|---|
| Monahan Teresa Frances | $340,000 | Meridian Title Corporation | |
| Geraldine S Wright Revocable Living Trus | -- | Attorney |
| Date | Event | Price | List to Sale | Price per Sq Ft | Prior Sale |
|---|---|---|---|---|---|
| 08/25/2023 08/25/23 | Sold | $340,000 | -5.8% | $172 / Sq Ft | |
| 07/12/2023 07/12/23 | Pending | -- | -- | -- | |
| 05/27/2023 05/27/23 | For Sale | $361,000 | +64.1% | $182 / Sq Ft | |
| 05/31/2016 05/31/16 | Sold | $220,000 | 0.0% | $73 / Sq Ft | View Prior Sale |
| 04/14/2016 04/14/16 | Pending | -- | -- | -- | |
| 03/31/2016 03/31/16 | Off Market | $220,000 | -- | -- | |
| 01/25/2016 01/25/16 | For Sale | $229,000 | +4.1% | $76 / Sq Ft | |
| 10/23/2015 10/23/15 | Off Market | $220,000 | -- | -- | |
| 09/29/2015 09/29/15 | Price Changed | $229,000 | -4.2% | $76 / Sq Ft | |
| 09/14/2015 09/14/15 | For Sale | $239,000 | -- | $79 / Sq Ft |
| Year | Tax Paid | Tax Assessment Tax Assessment Total Assessment is a certain percentage of the fair market value that is determined by local assessors to be the total taxable value of land and additions on the property. | Land | Improvement |
|---|---|---|---|---|
| 2024 | $3,068 | $272,000 | $52,300 | $219,700 |
| 2023 | $3,075 | $271,300 | $52,300 | $219,000 |
| 2022 | $3,021 | $264,500 | $52,300 | $212,200 |
| 2021 | $2,933 | $254,600 | $44,000 | $210,600 |
| 2020 | $2,596 | $226,500 | $44,000 | $182,500 |
| 2019 | $2,326 | $217,800 | $44,000 | $173,800 |
| 2018 | $2,773 | $213,200 | $44,000 | $169,200 |
| 2017 | $2,278 | $208,900 | $42,600 | $166,300 |
| 2016 | $2,283 | $208,700 | $42,600 | $166,100 |
| 2014 | $2,395 | $212,800 | $42,600 | $170,200 |
Seller's Agent in 2023
Kathy Boyce
RE/MAX Real Estate Prof
(812) 371-7558
34 in this area
50 Total Sales
Seller's Agent in 2016
Bev Roberts
CENTURY 21 Scheetz
(812) 343-9486
122 in this area
164 Total Sales
Source: MIBOR Broker Listing Cooperative®
MLS Number: 21923648
APN: 03-95-28-410-005.500-005
Disclaimer: Certain information contained herein is derived from information provided by parties other than Homes.com. All information provided is deemed reliable, but is not guaranteed to be accurate and should be independently verified.
![]() Based on information submitted to the MLS GRID. All data is obtained from various sources and may not have been verified by broker or MLS GRID. Supplied Open House Information is subject to change without notice. All information should be independently reviewed and verified for accuracy. Properties may or may not be listed by the office/agent presenting the information. Some IDX listings have been excluded from this website.
Based on information submitted to the MLS GRID. All data is obtained from various sources and may not have been verified by broker or MLS GRID. Supplied Open House Information is subject to change without notice. All information should be independently reviewed and verified for accuracy. Properties may or may not be listed by the office/agent presenting the information. Some IDX listings have been excluded from this website.