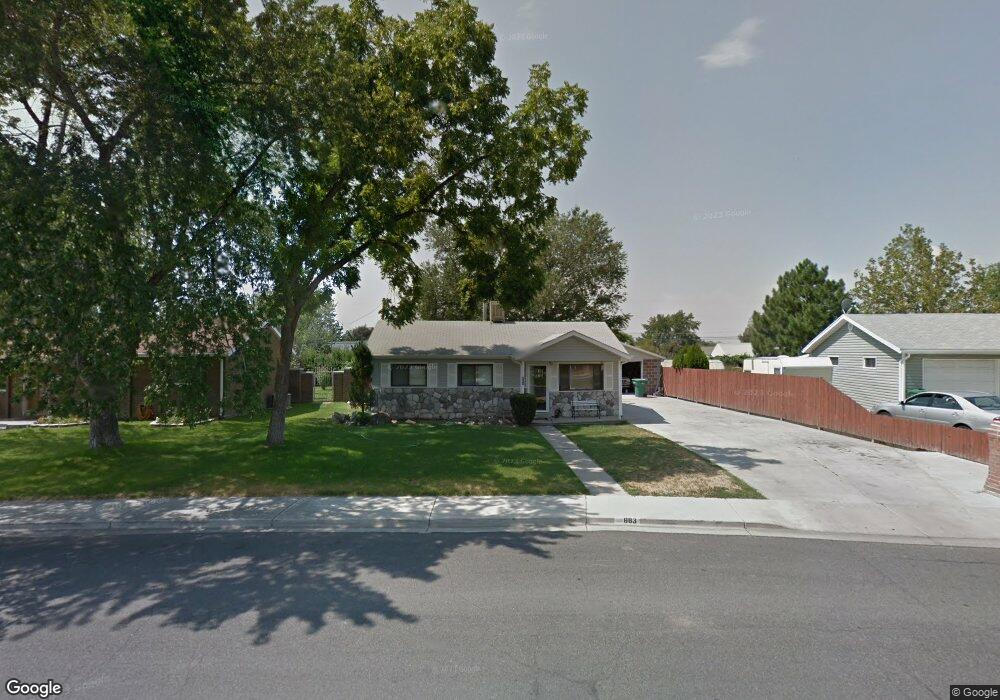
683 Orchard Dr Orem, UT 84057
Sharon NeighborhoodEstimated Value: $374,000 - $427,000
3
Beds
1
Bath
958
Sq Ft
$421/Sq Ft
Est. Value
About This Home
This home is located at 683 Orchard Dr, Orem, UT 84057 and is currently estimated at $403,409, approximately $421 per square foot. 683 Orchard Dr is a home located in Utah County with nearby schools including Cascade Elementary School, Canyon View Junior High School, and Orem High School.
Ownership History
Date
Name
Owned For
Owner Type
Purchase Details
Closed on
Nov 25, 2025
Sold by
Dekker Christine Ann and Dekker Norman Ray
Bought by
Dekker Christine A and Dekker Norman Ray
Current Estimated Value
Home Financials for this Owner
Home Financials are based on the most recent Mortgage that was taken out on this home.
Original Mortgage
$300,000
Outstanding Balance
$299,431
Interest Rate
6.27%
Mortgage Type
New Conventional
Estimated Equity
$103,978
Purchase Details
Closed on
Dec 11, 2020
Sold by
Dekker Norman and Dekker Christine
Bought by
Dekker Christine Ann and Dekker Norman Ray
Home Financials for this Owner
Home Financials are based on the most recent Mortgage that was taken out on this home.
Original Mortgage
$186,202
Interest Rate
2.7%
Mortgage Type
FHA
Purchase Details
Closed on
Dec 1, 2005
Sold by
Lees Jeffrey Scott and Lees Tammi
Bought by
Dekker Norman and Dekker Christine
Purchase Details
Closed on
Aug 10, 2001
Sold by
Lees Jeffrey Scott and Nuttall Tammi
Bought by
Lees Jeffrey Scott and Lees Tammi
Home Financials for this Owner
Home Financials are based on the most recent Mortgage that was taken out on this home.
Original Mortgage
$112,500
Interest Rate
7.19%
Create a Home Valuation Report for This Property
The Home Valuation Report is an in-depth analysis detailing your home's value as well as a comparison with similar homes in the area
Home Values in the Area
Average Home Value in this Area
Purchase History
| Date | Buyer | Sale Price | Title Company |
|---|---|---|---|
| Dekker Christine A | -- | Meridian Title Company | |
| Dekker Christine Ann | -- | North American Title | |
| Dekker Norman | -- | Affiliated First Title Comp | |
| Lees Jeffrey Scott | -- | Signature Title |
Source: Public Records
Mortgage History
| Date | Status | Borrower | Loan Amount |
|---|---|---|---|
| Open | Dekker Christine A | $300,000 | |
| Previous Owner | Dekker Christine Ann | $186,202 | |
| Previous Owner | Lees Jeffrey Scott | $112,500 |
Source: Public Records
Tax History
| Year | Tax Paid | Tax Assessment Tax Assessment Total Assessment is a certain percentage of the fair market value that is determined by local assessors to be the total taxable value of land and additions on the property. | Land | Improvement |
|---|---|---|---|---|
| 2025 | $1,550 | $197,560 | -- | -- |
| 2024 | $1,550 | $189,475 | $0 | $0 |
| 2023 | $1,420 | $186,670 | $0 | $0 |
| 2022 | $1,496 | $190,520 | $0 | $0 |
| 2021 | $1,268 | $244,500 | $129,500 | $115,000 |
| 2020 | $1,141 | $216,300 | $103,600 | $112,700 |
| 2019 | $1,039 | $204,800 | $93,500 | $111,300 |
| 2018 | $963 | $181,400 | $83,500 | $97,900 |
| 2017 | $883 | $89,045 | $0 | $0 |
| 2016 | $806 | $75,020 | $0 | $0 |
| 2015 | $782 | $68,805 | $0 | $0 |
| 2014 | $786 | $68,805 | $0 | $0 |
Source: Public Records
Map
Nearby Homes
- 693 Orchard Dr
- 673 Orchard Dr
- 663 Orchard Dr
- 703 Orchard Dr
- 660 Atlantis Dr
- 682 Orchard Dr
- 670 Atlantis Dr
- 680 Atlantis Dr
- 650 Atlantis Dr
- 672 Orchard Dr
- 653 Orchard Dr
- 690 Atlantis Dr
- 713 Orchard Dr
- 640 Atlantis Dr
- 221 E 700 N
- 662 Orchard Dr
- 710 Atlantis Dr
- 232 E 700 N
- 643 Orchard Dr
- 630 Atlantis Dr
Your Personal Tour Guide
Ask me questions while you tour the home.