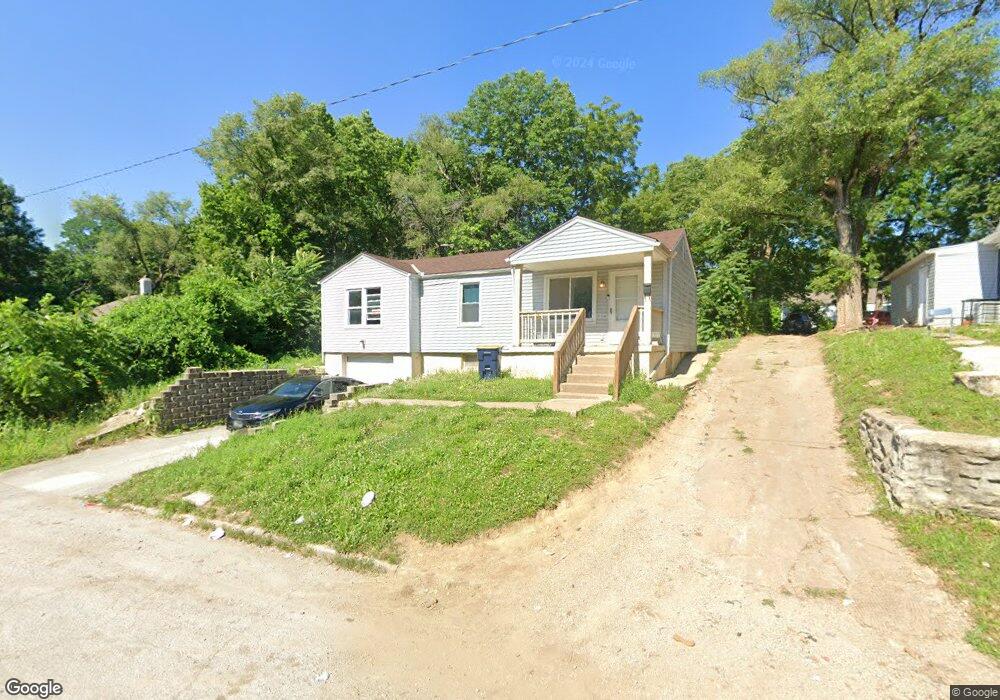
6830 Bales Ave Kansas City, MO 64132
Estimated Value: $103,035 - $160,000
3
Beds
1
Bath
875
Sq Ft
$139/Sq Ft
Est. Value
About This Home
This home is located at 6830 Bales Ave, Kansas City, MO 64132 and is currently estimated at $121,759, approximately $139 per square foot. 6830 Bales Ave is a home located in Jackson County with nearby schools including Benjamin Banneker Elementary School, Central Middle School, and Southeast High School.
Ownership History
Date
Name
Owned For
Owner Type
Purchase Details
Closed on
Sep 23, 2004
Sold by
Worthen Frederick J and Worthen Frederick F
Bought by
Frazier Marcus D and Frazier Lisa D
Current Estimated Value
Home Financials for this Owner
Home Financials are based on the most recent Mortgage that was taken out on this home.
Original Mortgage
$64,800
Outstanding Balance
$34,576
Interest Rate
7.05%
Mortgage Type
Purchase Money Mortgage
Estimated Equity
$87,183
Purchase Details
Closed on
Mar 25, 2004
Sold by
Fannie Mae
Bought by
Worthen Frederick J
Purchase Details
Closed on
Jul 9, 2001
Sold by
Associates Financial Svcs Of America Inc
Bought by
Cossey Steve R
Purchase Details
Closed on
Mar 27, 2000
Sold by
Lyles and Caroline
Bought by
Associates Financial Svcs Of American In
Create a Home Valuation Report for This Property
The Home Valuation Report is an in-depth analysis detailing your home's value as well as a comparison with similar homes in the area
Home Values in the Area
Average Home Value in this Area
Purchase History
| Date | Buyer | Sale Price | Title Company |
|---|---|---|---|
| Frazier Marcus D | -- | Commonwealth Title | |
| Worthen Frederick J | -- | -- | |
| Cossey Steve R | $9,000 | Assured Quality Title Co | |
| Associates Financial Svcs Of American In | $68,545 | First American Title Ins |
Source: Public Records
Mortgage History
| Date | Status | Borrower | Loan Amount |
|---|---|---|---|
| Open | Frazier Marcus D | $64,800 | |
| Closed | Frazier Marcus D | $16,200 |
Source: Public Records
Tax History Compared to Growth
Tax History
| Year | Tax Paid | Tax Assessment Tax Assessment Total Assessment is a certain percentage of the fair market value that is determined by local assessors to be the total taxable value of land and additions on the property. | Land | Improvement |
|---|---|---|---|---|
| 2025 | $636 | $8,041 | $1,427 | $6,614 |
| 2024 | $630 | $8,060 | $1,537 | $6,523 |
| 2023 | $630 | $8,060 | $870 | $7,190 |
| 2022 | $500 | $6,080 | $1,938 | $4,142 |
| 2021 | $498 | $6,080 | $1,938 | $4,142 |
| 2020 | $504 | $6,071 | $1,938 | $4,133 |
| 2019 | $494 | $6,071 | $1,938 | $4,133 |
| 2018 | $410 | $5,149 | $753 | $4,396 |
| 2017 | $402 | $5,149 | $753 | $4,396 |
| 2016 | $402 | $5,021 | $623 | $4,398 |
| 2014 | $403 | $5,021 | $623 | $4,398 |
Source: Public Records
Map
Nearby Homes
- 6821 Bales Ave
- 6727 Bales Ave
- 3503 E 67th St
- 6745 Cleveland Ave
- 3114 E 68th St
- 6656 Bales Ave
- 6942 College Ave
- 6933 Walrond Ave
- 6701 Walrond Ave
- 3822 E 68th Terrace
- 7015 College Ave
- 6610 Askew Ave
- 6947 Bellefontaine Ave
- 6727 Agnes Ave
- 7013 Bellefontaine Ave
- 4015 E 68th Terrace
- 6823 S Benton Ave
- 6815 S Benton Ave
- 6721 S Benton Ave
- 7115 Bellefontaine Ave
- 6828 Bales Ave
- 6816 Bales Ave
- 6833 Bales Ave
- 6842 Bales Ave
- 6823 Bales Ave
- 6837 Bales Ave
- 6814 Bales Ave
- 6844 Bales Ave
- 6841 Bales Ave
- 6812 Bales Ave
- 6848 Bales Ave
- 6845 Bales Ave
- 6813 Bales Ave
- 6829 Indiana Ave
- 6825 Indiana Ave
- 6843 Indiana Ave
- 6808 Bales Ave
- 6821 Indiana Ave
- 6817 Indiana Ave
- 3400 E 69th St