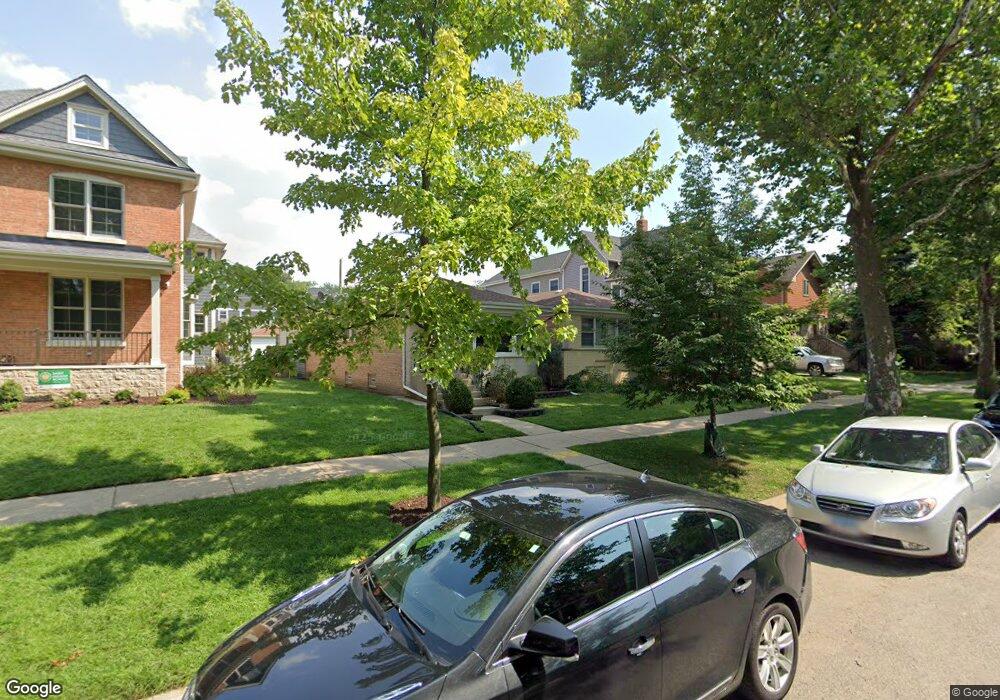
6831 N Oleander Ave Chicago, IL 60631
Edison Park NeighborhoodEstimated Value: $414,000 - $1,113,070
3
Beds
1
Bath
975
Sq Ft
$783/Sq Ft
Est. Value
About This Home
This home is located at 6831 N Oleander Ave, Chicago, IL 60631 and is currently estimated at $763,535, approximately $783 per square foot. 6831 N Oleander Ave is a home located in Cook County with nearby schools including Ebinger Elementary School, Taft High School, and St. Juliana School.
Ownership History
Date
Name
Owned For
Owner Type
Purchase Details
Closed on
May 30, 2024
Sold by
Brian T Dore Trust and Dore Brian T
Bought by
Harder Beau and Rzotkiewicz Jessica
Current Estimated Value
Home Financials for this Owner
Home Financials are based on the most recent Mortgage that was taken out on this home.
Original Mortgage
$825,600
Outstanding Balance
$815,284
Interest Rate
7.13%
Mortgage Type
New Conventional
Estimated Equity
-$51,749
Purchase Details
Closed on
Apr 16, 2021
Sold by
Reider Matthew and Reider Ann Marie
Bought by
Dore Brian T and Brian T Dore Trust
Purchase Details
Closed on
Jul 30, 1996
Sold by
Fleming John P
Bought by
Reider Matthew and Despasquale Ann Marie
Home Financials for this Owner
Home Financials are based on the most recent Mortgage that was taken out on this home.
Original Mortgage
$152,000
Interest Rate
8.23%
Create a Home Valuation Report for This Property
The Home Valuation Report is an in-depth analysis detailing your home's value as well as a comparison with similar homes in the area
Home Values in the Area
Average Home Value in this Area
Purchase History
| Date | Buyer | Sale Price | Title Company |
|---|---|---|---|
| Harder Beau | $1,032,000 | Proper Title | |
| Dore Brian T | $280,000 | Chicago Title | |
| Reider Matthew | $109,000 | -- |
Source: Public Records
Mortgage History
| Date | Status | Borrower | Loan Amount |
|---|---|---|---|
| Open | Harder Beau | $825,600 | |
| Previous Owner | Reider Matthew | $152,000 |
Source: Public Records
Tax History Compared to Growth
Tax History
| Year | Tax Paid | Tax Assessment Tax Assessment Total Assessment is a certain percentage of the fair market value that is determined by local assessors to be the total taxable value of land and additions on the property. | Land | Improvement |
|---|---|---|---|---|
| 2024 | $1,551 | $9,188 | $9,188 | -- |
| 2023 | $1,512 | $7,350 | $7,350 | -- |
| 2022 | $1,512 | $7,350 | $7,350 | $0 |
| 2021 | $6,972 | $38,000 | $7,350 | $30,650 |
| 2020 | $5,341 | $27,078 | $4,961 | $22,117 |
| 2019 | $5,356 | $30,087 | $4,961 | $25,126 |
| 2018 | $5,900 | $33,304 | $4,961 | $28,343 |
| 2017 | $5,183 | $27,450 | $4,410 | $23,040 |
| 2016 | $4,998 | $27,450 | $4,410 | $23,040 |
| 2015 | $4,549 | $27,450 | $4,410 | $23,040 |
| 2014 | $4,506 | $26,854 | $3,675 | $23,179 |
| 2013 | $4,406 | $26,854 | $3,675 | $23,179 |
Source: Public Records
Map
Nearby Homes
- 6681 N Northwest Hwy
- 6727 N Oketo Ave
- 6919 N Overhill Ave
- 6625 N Northwest Hwy Unit 202
- 7005 N Osceola Ave
- 6841 N Northwest Hwy Unit 3C
- 6815 N Olmsted Ave Unit 203
- 7039 N Ottawa Ave
- 6852 N Northwest Hwy Unit 2B
- 6858 N Northwest Hwy Unit 2E
- 7315 W Lunt Ave
- 7324 W Lunt Ave
- 7101 N Ottawa Ave
- 7215 W Farwell Ave
- 460 S Northwest Hwy Unit 307A
- 400 S Northwest Hwy Unit 312B
- 6524 N Northwest Hwy Unit A
- 6500 N Northwest Hwy
- 7215 N Olcott Ave
- 6490 N Northwest Hwy Unit 3F
- 6833 N Oleander Ave
- 6829 N Oleander Ave
- 6837 N Oleander Ave
- 6821 N Oleander Ave
- 6821 N Oleander Ave
- 6841 N Oleander Ave
- 6815 N Oleander Ave
- 6845 N Oleander Ave
- 6826 N Olcott Ave
- 6830 N Olcott Ave
- 6822 N Olcott Ave
- 6836 N Olcott Ave
- 6811 N Oleander Ave
- 6816 N Olcott Ave
- 6840 N Olcott Ave
- 6830 N Oleander Ave
- 6849 N Oleander Ave
- 6836 N Oleander Ave
- 6826 N Oleander Ave
- 6838 N Oleander Ave