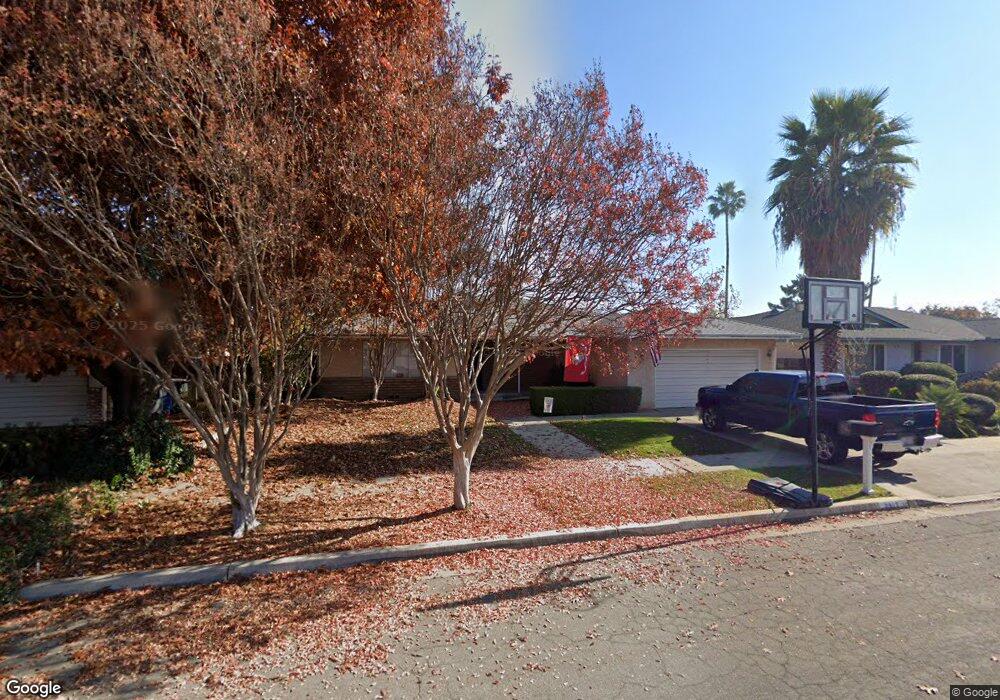
6832 N Laureen Ave Fresno, CA 93710
Hoover NeighborhoodEstimated Value: $441,645 - $492,000
4
Beds
2
Baths
1,951
Sq Ft
$239/Sq Ft
Est. Value
About This Home
This home is located at 6832 N Laureen Ave, Fresno, CA 93710 and is currently estimated at $467,161, approximately $239 per square foot. 6832 N Laureen Ave is a home located in Fresno County with nearby schools including Cole Elementary School, Alta Sierra Intermediate School, and Buchanan High School.
Ownership History
Date
Name
Owned For
Owner Type
Purchase Details
Closed on
Apr 29, 2008
Sold by
Walls Thomas L and Walls Laura
Bought by
Robertson Eric T and Robertson Patricia H
Current Estimated Value
Home Financials for this Owner
Home Financials are based on the most recent Mortgage that was taken out on this home.
Original Mortgage
$251,492
Interest Rate
6.04%
Mortgage Type
FHA
Purchase Details
Closed on
Jan 24, 2005
Sold by
Walls Thomas L and Walls Laura
Bought by
Walls Thomas L and Walls Laura
Home Financials for this Owner
Home Financials are based on the most recent Mortgage that was taken out on this home.
Original Mortgage
$182,678
Interest Rate
7.2%
Mortgage Type
Purchase Money Mortgage
Purchase Details
Closed on
Mar 19, 1999
Sold by
Walter Galbraith Michael
Bought by
Walls Thomas L and Kyle Laura
Home Financials for this Owner
Home Financials are based on the most recent Mortgage that was taken out on this home.
Original Mortgage
$117,300
Interest Rate
6.91%
Mortgage Type
VA
Create a Home Valuation Report for This Property
The Home Valuation Report is an in-depth analysis detailing your home's value as well as a comparison with similar homes in the area
Home Values in the Area
Average Home Value in this Area
Purchase History
| Date | Buyer | Sale Price | Title Company |
|---|---|---|---|
| Robertson Eric T | $255,500 | Chicago Title Company | |
| Walls Thomas L | -- | Chicago Title Co | |
| Walls Thomas L | $115,500 | Stewart Title |
Source: Public Records
Mortgage History
| Date | Status | Borrower | Loan Amount |
|---|---|---|---|
| Previous Owner | Robertson Eric T | $251,492 | |
| Previous Owner | Walls Thomas L | $182,678 | |
| Previous Owner | Walls Thomas L | $117,300 | |
| Closed | Walls Thomas L | $50,000 |
Source: Public Records
Tax History Compared to Growth
Tax History
| Year | Tax Paid | Tax Assessment Tax Assessment Total Assessment is a certain percentage of the fair market value that is determined by local assessors to be the total taxable value of land and additions on the property. | Land | Improvement |
|---|---|---|---|---|
| 2025 | $5,999 | $328,881 | $90,135 | $238,746 |
| 2023 | $5,924 | $316,112 | $86,636 | $229,476 |
| 2022 | $5,872 | $309,915 | $84,938 | $224,977 |
| 2021 | $5,767 | $303,839 | $83,273 | $220,566 |
| 2020 | $5,707 | $300,725 | $82,420 | $218,305 |
| 2019 | $5,636 | $294,829 | $80,804 | $214,025 |
| 2018 | $5,553 | $289,049 | $79,220 | $209,829 |
| 2017 | $5,472 | $283,382 | $77,667 | $205,715 |
| 2016 | $3,352 | $277,827 | $76,145 | $201,682 |
| 2015 | $3,186 | $264,100 | $72,400 | $191,700 |
| 2014 | $2,988 | $247,300 | $67,800 | $179,500 |
Source: Public Records
Map
Nearby Homes
- 6660 N Winery Ave
- 2669 E Sean Ave
- 2625 E Sean Ave
- 2954 Tierra Dr
- 2942 E Tierra Dr
- 2894 Tierra Dr
- 2882 Tierra Dr
- 2550 E Jenny Ave
- 2870 Tierra Dr
- 0 Willow Bluff Unit 638378
- 150 N Anderson Ave
- 6776 N Woodrow Ave
- 2728 E Sierra Ave
- 563 N Chapel Hill Ln
- 510 W Mahogany Ln
- 460 W Balsam Ln
- 2658 E Alluvial Ave Unit 220
- 6583 N Maple Ave
- 194 Cindy Ave
- 493 Timmy Ave
- 6844 N Laureen Ave
- 6820 N Laureen Ave
- 6837 N Winery Ave
- 6823 N Winery Ave
- 6856 N Laureen Ave
- 6851 N Winery Ave
- 6808 N Laureen Ave
- 6833 N Laureen Ave
- 6811 N Winery Ave
- 6821 N Laureen Ave
- 6845 N Laureen Ave
- 6865 N Winery Ave
- 6870 N Laureen Ave
- 6809 N Laureen Ave
- 6857 N Laureen Ave
- 6877 N Winery Ave
- 6836 N Winery Ave
- 6848 N Winery Ave
- 6824 N Winery Ave
- 3177 E Magill Ave