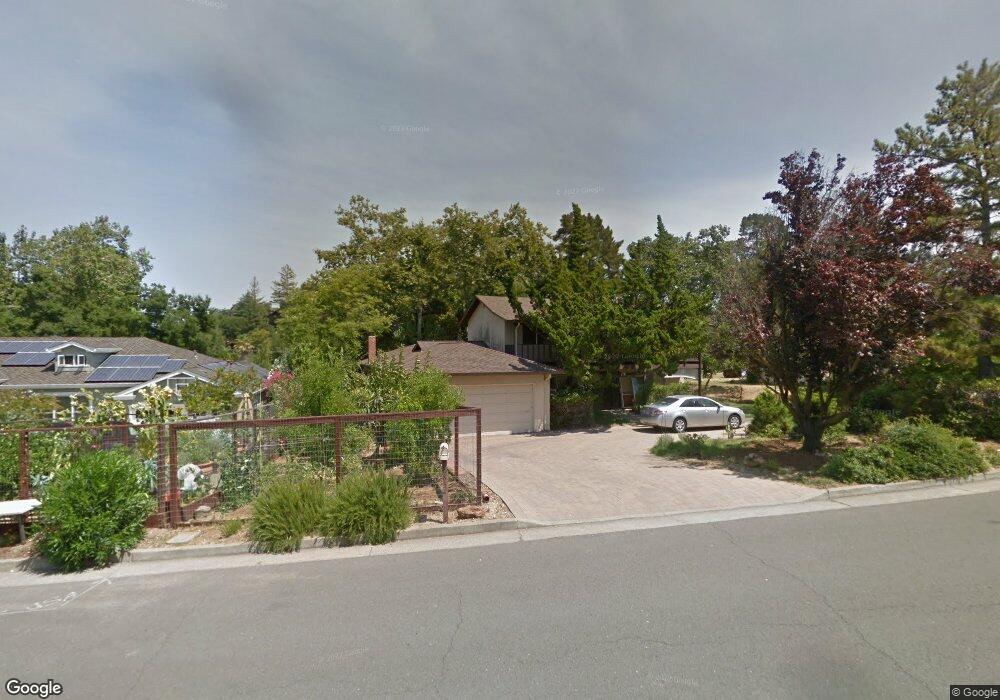
6834 Hampton Dr San Jose, CA 95120
Country Club NeighborhoodEstimated Value: $2,808,661 - $3,342,000
6
Beds
4
Baths
3,188
Sq Ft
$938/Sq Ft
Est. Value
About This Home
This home is located at 6834 Hampton Dr, San Jose, CA 95120 and is currently estimated at $2,991,165, approximately $938 per square foot. 6834 Hampton Dr is a home located in Santa Clara County with nearby schools including Williams Elementary School, Bret Harte Middle School, and Leland High School.
Ownership History
Date
Name
Owned For
Owner Type
Purchase Details
Closed on
Jun 2, 2017
Sold by
Qian Gui Bai and Li Mei
Bought by
Qian Gui Bai and Li Mei
Current Estimated Value
Home Financials for this Owner
Home Financials are based on the most recent Mortgage that was taken out on this home.
Original Mortgage
$570,000
Interest Rate
3.96%
Mortgage Type
New Conventional
Purchase Details
Closed on
Feb 1, 2017
Sold by
Qian Gui Bai and Li Mei
Bought by
Qian Gui Bai and Li Mei
Home Financials for this Owner
Home Financials are based on the most recent Mortgage that was taken out on this home.
Original Mortgage
$583,000
Interest Rate
4.32%
Mortgage Type
New Conventional
Purchase Details
Closed on
Dec 2, 2002
Sold by
Qian Gui Bai and Li Mei
Bought by
Qian Gui Bai and Li Mei
Create a Home Valuation Report for This Property
The Home Valuation Report is an in-depth analysis detailing your home's value as well as a comparison with similar homes in the area
Home Values in the Area
Average Home Value in this Area
Purchase History
| Date | Buyer | Sale Price | Title Company |
|---|---|---|---|
| Qian Gui Bai | -- | Accommodation | |
| Qian Gui Bai | -- | Chicago Title Company | |
| Qian Gui Bai | -- | Accommodation | |
| Qian Gui Bai | -- | Chicago Title Company | |
| Qian Gui Bai | -- | -- |
Source: Public Records
Mortgage History
| Date | Status | Borrower | Loan Amount |
|---|---|---|---|
| Closed | Qian Gui Bai | $570,000 | |
| Closed | Qian Gui Bai | $583,000 |
Source: Public Records
Tax History
| Year | Tax Paid | Tax Assessment Tax Assessment Total Assessment is a certain percentage of the fair market value that is determined by local assessors to be the total taxable value of land and additions on the property. | Land | Improvement |
|---|---|---|---|---|
| 2025 | $9,929 | $748,546 | $262,708 | $485,838 |
| 2024 | $9,929 | $733,869 | $257,557 | $476,312 |
| 2023 | $9,728 | $719,480 | $252,507 | $466,973 |
| 2022 | $9,643 | $705,373 | $247,556 | $457,817 |
| 2021 | $9,430 | $691,543 | $242,702 | $448,841 |
| 2020 | $9,204 | $684,453 | $240,214 | $444,239 |
| 2019 | $9,001 | $671,033 | $235,504 | $435,529 |
| 2018 | $8,904 | $657,877 | $230,887 | $426,990 |
| 2017 | $8,828 | $644,978 | $226,360 | $418,618 |
| 2016 | $8,651 | $632,332 | $221,922 | $410,410 |
| 2015 | $8,590 | $622,835 | $218,589 | $404,246 |
| 2014 | $8,140 | $610,636 | $214,308 | $396,328 |
Source: Public Records
Map
Nearby Homes
- 1182 Olive Branch Ln
- 1171 Wilhelmina Way
- 7111 Echo Loop
- 1321 Echo Valley Dr
- 6805 Almaden Rd
- 1241 Hillcrest Dr
- 1168 Valley Quail Cir
- 1259 Hillcrest Dr
- 1054 Quail Creek Cir
- 1059 Quail Creek Cir
- 1027 Nightfall Ct
- 1115 Bartlett Creek Ct
- 000 Box Canyon Rd
- 1036 Bret Cove Ct
- 6834 Rockview Ct
- 1134 Falcon Ridge Ct
- 6824 Leyland Park Dr
- 6448 Menlo Dr
- 21287 Almaden Rd
- 6856 Eldridge Dr
- 6830 Hampton Dr
- 6809 Elwood Rd
- 6848 Hampton Dr
- 6824 Hampton Dr
- 6817 Elwood Rd
- 1202 Rockhaven Dr
- 6801 Elwood Rd
- 6835 Hampton Dr
- 6841 Hampton Dr
- 6856 Hampton Dr
- 6845 Hampton Dr
- 6819 Hampton Dr
- 6823 Elwood Rd
- 6793 Elwood Rd
- 6818 Hampton Dr
- 1206 Rockhaven Dr
- 6849 Hampton Dr
- 1203 Rockhaven Dr
- 6864 Hampton Dr
- 6812 Elwood Rd
Your Personal Tour Guide
Ask me questions while you tour the home.