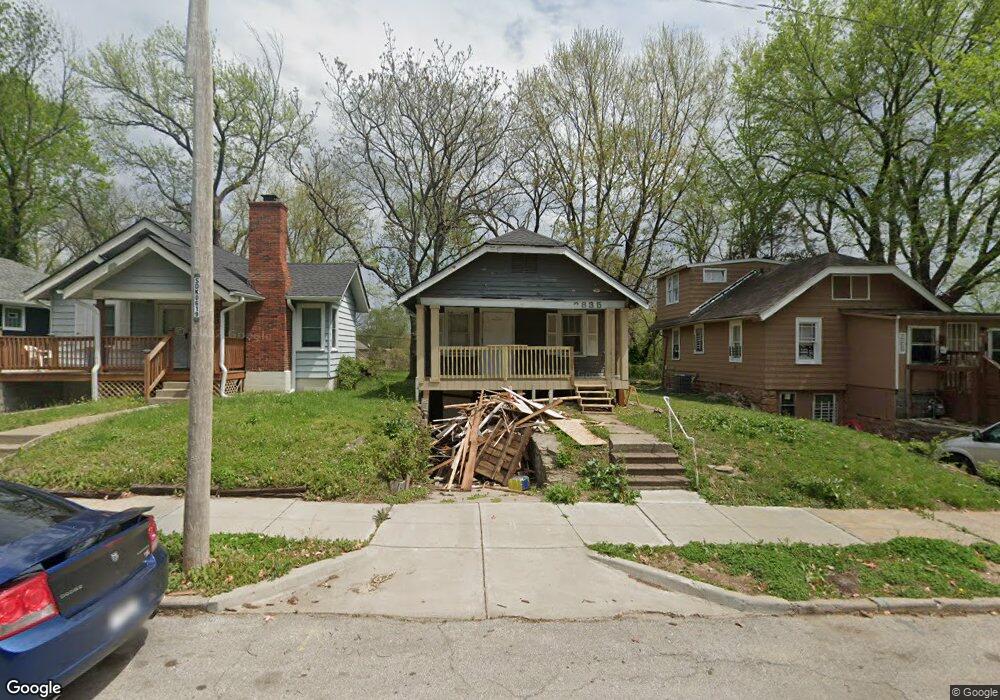
6835 S Benton Ave Kansas City, MO 64132
Estimated Value: $127,000 - $190,000
3
Beds
1
Bath
840
Sq Ft
$171/Sq Ft
Est. Value
About This Home
This home is located at 6835 S Benton Ave, Kansas City, MO 64132 and is currently estimated at $143,318, approximately $170 per square foot. 6835 S Benton Ave is a home located in Jackson County with nearby schools including Benjamin Banneker Elementary School, Central Middle School, and Southeast High School.
Ownership History
Date
Name
Owned For
Owner Type
Purchase Details
Closed on
Jan 14, 2023
Sold by
Huesca Laurencio and Huesca Hilda Crisanto
Bought by
Rivera Andres Luna
Current Estimated Value
Home Financials for this Owner
Home Financials are based on the most recent Mortgage that was taken out on this home.
Original Mortgage
$125,000
Outstanding Balance
$120,617
Interest Rate
6.27%
Mortgage Type
Seller Take Back
Estimated Equity
$22,701
Purchase Details
Closed on
Jan 18, 2022
Sold by
Jeremy Beasley
Bought by
Huesca Laurencio and Huesca Cristanto Hilda
Purchase Details
Closed on
Sep 13, 2021
Sold by
Rons Contracting Services Llc
Bought by
Beasley Jeremy
Purchase Details
Closed on
Aug 15, 2020
Sold by
Kong Holdings Llc
Bought by
Rons Contracting Services Llc
Purchase Details
Closed on
Nov 1, 2017
Sold by
Kongmanichanh Suena
Bought by
Kong Holdings Llc
Purchase Details
Closed on
Nov 17, 2016
Sold by
Land Bank Of Kansas City Missouri
Bought by
Kongmanichanh Suena
Home Financials for this Owner
Home Financials are based on the most recent Mortgage that was taken out on this home.
Original Mortgage
$25,000
Interest Rate
3.42%
Mortgage Type
Seller Take Back
Purchase Details
Closed on
Dec 26, 2007
Sold by
Mid American Credit Group Llc
Bought by
Morrow Daverick
Purchase Details
Closed on
Sep 24, 2007
Sold by
U S Bank Na
Bought by
Mid America Credit Group
Purchase Details
Closed on
Mar 15, 2007
Sold by
Harrison Carl
Bought by
U S Bank Na and C-Bass Mortgage Loan Asset Backed Certif
Purchase Details
Closed on
Dec 17, 2003
Sold by
Sunrise Assets Llc
Bought by
Harrison Carl
Home Financials for this Owner
Home Financials are based on the most recent Mortgage that was taken out on this home.
Original Mortgage
$63,000
Interest Rate
5.97%
Mortgage Type
Purchase Money Mortgage
Purchase Details
Closed on
Jan 3, 2002
Sold by
Kajer M P
Bought by
Potts Tanya L
Home Financials for this Owner
Home Financials are based on the most recent Mortgage that was taken out on this home.
Original Mortgage
$45,288
Interest Rate
7.07%
Mortgage Type
Purchase Money Mortgage
Purchase Details
Closed on
Jul 1, 2001
Sold by
Philcorp Capital Inc
Bought by
Kajer M P and The South Benton Trust
Purchase Details
Closed on
Jul 1, 1998
Sold by
Littlefield and Eilene
Bought by
Philcorp Capital Inc
Create a Home Valuation Report for This Property
The Home Valuation Report is an in-depth analysis detailing your home's value as well as a comparison with similar homes in the area
Home Values in the Area
Average Home Value in this Area
Purchase History
| Date | Buyer | Sale Price | Title Company |
|---|---|---|---|
| Rivera Andres Luna | -- | -- | |
| Huesca Laurencio | -- | None Listed On Document | |
| Huesca Laurencio | -- | None Listed On Document | |
| Huesca Laurencio | -- | None Listed On Document | |
| Beasley Jeremy | -- | None Listed On Document | |
| Rons Contracting Services Llc | -- | None Available | |
| Kong Holdings Llc | -- | None Available | |
| Kongmanichanh Suena | -- | None Available | |
| Morrow Daverick | -- | Charter Land Title Llc Main | |
| Mid America Credit Group | -- | First American Title | |
| U S Bank Na | $18,000 | None Available | |
| Harrison Carl | -- | Security Land Title Company | |
| Potts Tanya L | -- | Security Land Title Co | |
| Kajer M P | -- | Security Land Title Co | |
| Philcorp Capital Inc | -- | -- |
Source: Public Records
Mortgage History
| Date | Status | Borrower | Loan Amount |
|---|---|---|---|
| Open | Rivera Andres Luna | $125,000 | |
| Previous Owner | Kongmanichanh Suena | $25,000 | |
| Previous Owner | Harrison Carl | $63,000 | |
| Previous Owner | Potts Tanya L | $45,288 |
Source: Public Records
Tax History Compared to Growth
Tax History
| Year | Tax Paid | Tax Assessment Tax Assessment Total Assessment is a certain percentage of the fair market value that is determined by local assessors to be the total taxable value of land and additions on the property. | Land | Improvement |
|---|---|---|---|---|
| 2025 | $3,078 | $29,689 | $1,347 | $28,342 |
| 2024 | $3,059 | $26,600 | $5,191 | $21,409 |
| 2023 | $3,059 | $26,600 | $2,977 | $23,623 |
| 2022 | $1,260 | $3,420 | $1,104 | $2,316 |
| 2021 | $1,493 | $3,420 | $1,104 | $2,316 |
| 2020 | $1,222 | $3,425 | $1,104 | $2,321 |
| 2019 | $1,211 | $3,425 | $1,104 | $2,321 |
| 2018 | $258 | $3,238 | $432 | $2,806 |
| 2017 | $258 | $3,238 | $432 | $2,806 |
| 2016 | $0 | $2,883 | $483 | $2,400 |
| 2014 | $232 | $2,883 | $483 | $2,400 |
Source: Public Records
Map
Nearby Homes
- 6823 S Benton Ave
- 6815 S Benton Ave
- 6727 Agnes Ave
- 6721 S Benton Ave
- 3114 E 68th St
- 6947 Bellefontaine Ave
- 7012 S Benton Ave
- 6933 Walrond Ave
- 6701 Walrond Ave
- 7013 Bellefontaine Ave
- 6942 College Ave
- 7040 Agnes Ave
- 7015 College Ave
- 2422 E 70th Terrace
- 7103 Agnes Ave
- 2241 E 68th St
- 6821 Bales Ave
- 6727 Bales Ave
- 7115 Bellefontaine Ave
- 7119 Bellefontaine Ave
- 6837 S Benton Ave
- 6831 S Benton Ave
- 6829 S Benton Ave
- 6834 S Benton Ave
- 6836 S Benton Ave
- 6830 S Benton Ave
- 6827 S Benton Ave
- 2900 E 69th St
- 6826 S Benton Ave
- 2904 E 69th St
- 2908 E 69th St
- 2818 E 69th St
- 6830 Agnes Ave
- 2912 E 69th St
- 6834 Agnes Ave
- 6836 Agnes Ave
- 6819 S Benton Ave
- 6816 S Benton Ave
- 2812 E 69th St
- 6828 Agnes Ave