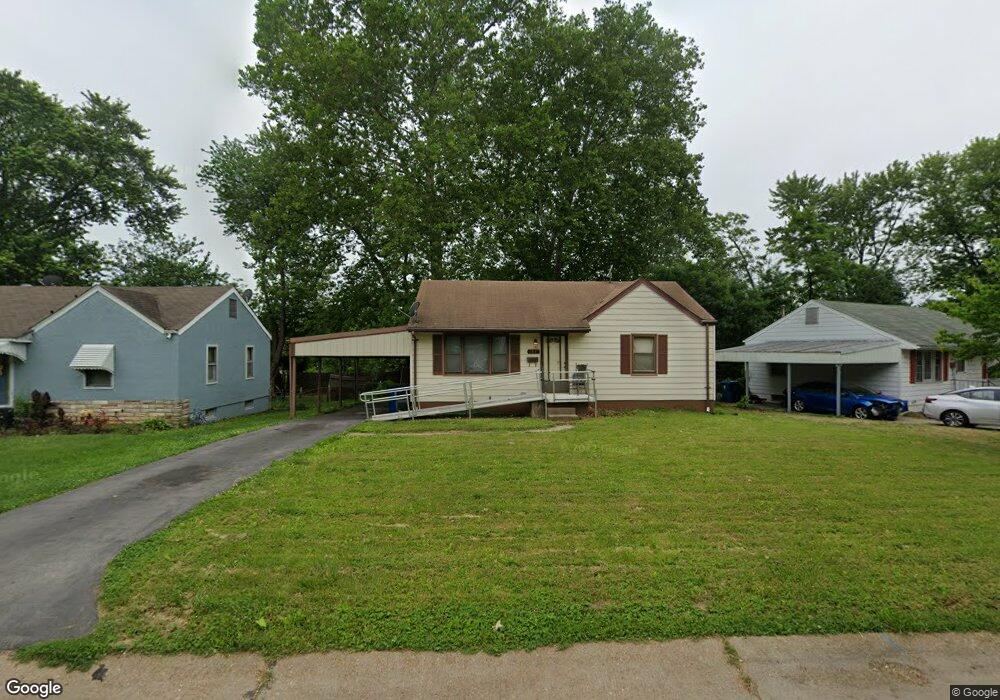
6837 Brower Ct Saint Louis, MO 63134
Estimated Value: $80,000 - $115,000
3
Beds
1
Bath
792
Sq Ft
$117/Sq Ft
Est. Value
About This Home
This home is located at 6837 Brower Ct, Saint Louis, MO 63134 and is currently estimated at $92,596, approximately $116 per square foot. 6837 Brower Ct is a home located in St. Louis County with nearby schools including Walnut Grove Elementary School, Ferguson Middle School, and McCluer High School.
Ownership History
Date
Name
Owned For
Owner Type
Purchase Details
Closed on
Mar 18, 2010
Sold by
The Bank Of New York Mellon
Bought by
Maddog Investments Llc
Current Estimated Value
Home Financials for this Owner
Home Financials are based on the most recent Mortgage that was taken out on this home.
Original Mortgage
$36,000
Outstanding Balance
$23,884
Interest Rate
5%
Mortgage Type
Future Advance Clause Open End Mortgage
Estimated Equity
$68,712
Purchase Details
Closed on
Feb 3, 2010
Sold by
Ward Shontell
Bought by
The Bank Of New York Mellon
Home Financials for this Owner
Home Financials are based on the most recent Mortgage that was taken out on this home.
Original Mortgage
$36,000
Outstanding Balance
$23,884
Interest Rate
5%
Mortgage Type
Future Advance Clause Open End Mortgage
Estimated Equity
$68,712
Purchase Details
Closed on
Feb 24, 1998
Sold by
Jurczyk Edward J and Jurczyk Jane Mary
Bought by
Ward Shontell
Home Financials for this Owner
Home Financials are based on the most recent Mortgage that was taken out on this home.
Original Mortgage
$36,720
Interest Rate
11.8%
Create a Home Valuation Report for This Property
The Home Valuation Report is an in-depth analysis detailing your home's value as well as a comparison with similar homes in the area
Home Values in the Area
Average Home Value in this Area
Purchase History
| Date | Buyer | Sale Price | Title Company |
|---|---|---|---|
| Maddog Investments Llc | $15,000 | Mokan Title Services Llc | |
| The Bank Of New York Mellon | $51,600 | None Available | |
| Ward Shontell | -- | -- |
Source: Public Records
Mortgage History
| Date | Status | Borrower | Loan Amount |
|---|---|---|---|
| Open | Maddog Investments Llc | $36,000 | |
| Previous Owner | Ward Shontell | $36,720 | |
| Closed | Ward Shontell | $6,885 |
Source: Public Records
Tax History Compared to Growth
Tax History
| Year | Tax Paid | Tax Assessment Tax Assessment Total Assessment is a certain percentage of the fair market value that is determined by local assessors to be the total taxable value of land and additions on the property. | Land | Improvement |
|---|---|---|---|---|
| 2025 | $1,036 | $18,250 | $2,000 | $16,250 |
| 2024 | $1,036 | $13,420 | $1,600 | $11,820 |
| 2023 | $1,023 | $13,420 | $1,600 | $11,820 |
| 2022 | $791 | $8,990 | $1,200 | $7,790 |
| 2021 | $786 | $10,300 | $1,200 | $9,100 |
| 2020 | $573 | $6,020 | $1,630 | $4,390 |
| 2019 | $549 | $6,020 | $1,630 | $4,390 |
| 2018 | $822 | $8,280 | $1,290 | $6,990 |
| 2017 | $817 | $8,280 | $1,290 | $6,990 |
| 2016 | $778 | $7,580 | $1,670 | $5,910 |
| 2015 | $755 | $7,580 | $1,670 | $5,910 |
| 2014 | $668 | $6,660 | $1,810 | $4,850 |
Source: Public Records
Map
Nearby Homes
- 8293 Frost Ave
- 230 Anistasia Dr
- 8401 Saint Olaf Dr
- 217 Anistasia Dr
- 8354 Latty Ave
- 6812 Saint Olaf Dr
- 7040 Clover Ln
- 6621 Dunwold Dr
- 8501 Frost Ave
- 6637 Torlina Dr
- 6605 Carol Lee Dr
- 6717 Thurston Ave
- 135 Grether Ave
- 110 Young Dr
- 135 Anistasia Dr
- 6612 Torlina Dr
- 8413 January Ave
- 6706 Alder Ave
- 13 Cady Dr
- 515 Marechal Ln
- 6841 Brower Ct
- 6831 Brower Ct
- 6827 Brower Ct
- 6808 Friarwood Dr
- 6812 Friarwood Dr
- 6847 Brower Ct
- 6818 Friarwood Dr
- 6804 Friarwood Dr
- 6840 Brower Ct
- 6851 Brower Ct
- 6834 Brower Ct
- 6821 Brower Ct
- 6802 Friarwood Dr
- 6844 Brower Ct
- 6830 Brower Ct
- 6824 Brower Ct
- 6817 Brower Ct
- 6826 Friarwood Dr
- 6850 Brower Ct
- 6800 Friarwood Dr