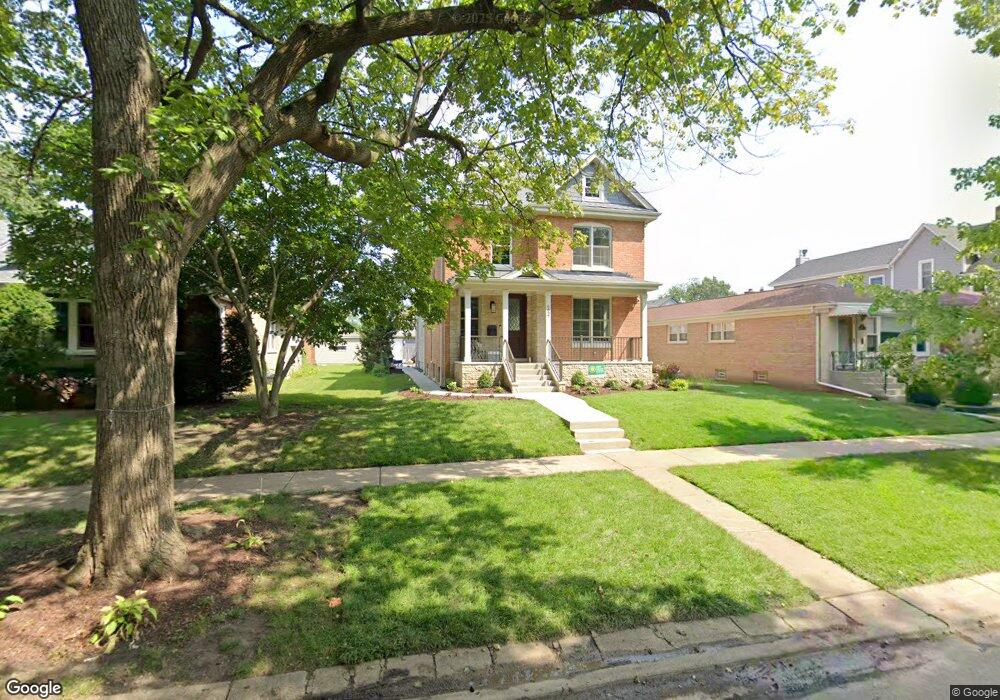
6837 N Oleander Ave Chicago, IL 60631
Edison Park NeighborhoodEstimated Value: $629,000 - $1,255,000
4
Beds
2
Baths
2,135
Sq Ft
$397/Sq Ft
Est. Value
About This Home
This home is located at 6837 N Oleander Ave, Chicago, IL 60631 and is currently estimated at $847,457, approximately $396 per square foot. 6837 N Oleander Ave is a home located in Cook County with nearby schools including Ebinger Elementary School, Taft High School, and St. Juliana School.
Ownership History
Date
Name
Owned For
Owner Type
Purchase Details
Closed on
Sep 8, 2021
Sold by
Mcauliffe Michael Patrick and Mcauliffe Kim
Bought by
Mcauliffe Kimberly Morreale and Bawana Trust
Current Estimated Value
Home Financials for this Owner
Home Financials are based on the most recent Mortgage that was taken out on this home.
Original Mortgage
$755,000
Outstanding Balance
$687,705
Interest Rate
2.87%
Mortgage Type
New Conventional
Estimated Equity
$159,752
Purchase Details
Closed on
Feb 16, 2017
Sold by
Grandview Capital Llc
Bought by
Mcauliffe Michael and Mcauliffe Kim
Home Financials for this Owner
Home Financials are based on the most recent Mortgage that was taken out on this home.
Original Mortgage
$1,648,000
Interest Rate
5.5%
Mortgage Type
Construction
Purchase Details
Closed on
Nov 14, 2016
Sold by
Damert William
Bought by
Grandview Capital Llc and Grandview Properties
Purchase Details
Closed on
Apr 26, 2000
Sold by
Lasalle Bank National Assn
Bought by
Damert Carl and Damert Lucille
Create a Home Valuation Report for This Property
The Home Valuation Report is an in-depth analysis detailing your home's value as well as a comparison with similar homes in the area
Home Values in the Area
Average Home Value in this Area
Purchase History
| Date | Buyer | Sale Price | Title Company |
|---|---|---|---|
| Mcauliffe Kimberly Morreale | -- | Accommodation | |
| Mcauliffe Michael | $405,000 | Attorney | |
| Grandview Capital Llc | $333,000 | Chicago Title | |
| Damert Carl | -- | -- |
Source: Public Records
Mortgage History
| Date | Status | Borrower | Loan Amount |
|---|---|---|---|
| Open | Mcauliffe Kimberly Morreale | $755,000 | |
| Previous Owner | Mcauliffe Michael | $1,648,000 |
Source: Public Records
Tax History Compared to Growth
Tax History
| Year | Tax Paid | Tax Assessment Tax Assessment Total Assessment is a certain percentage of the fair market value that is determined by local assessors to be the total taxable value of land and additions on the property. | Land | Improvement |
|---|---|---|---|---|
| 2024 | $13,321 | $84,000 | $18,375 | $65,625 |
| 2023 | $12,964 | $73,951 | $14,700 | $59,251 |
| 2022 | $12,964 | $73,951 | $14,700 | $59,251 |
| 2021 | $12,693 | $66,451 | $14,700 | $51,751 |
| 2020 | $13,426 | $60,267 | $9,922 | $50,345 |
| 2019 | $13,454 | $66,964 | $9,922 | $57,042 |
| 2018 | $11,163 | $56,514 | $9,922 | $46,592 |
| 2017 | $8,650 | $40,183 | $8,820 | $31,363 |
| 2016 | $7,548 | $40,183 | $8,820 | $31,363 |
| 2015 | $6,883 | $40,183 | $8,820 | $31,363 |
| 2014 | $6,663 | $38,479 | $7,350 | $31,129 |
| 2013 | $6,520 | $38,479 | $7,350 | $31,129 |
Source: Public Records
Map
Nearby Homes
- 6681 N Northwest Hwy
- 6727 N Oketo Ave
- 6919 N Overhill Ave
- 6625 N Northwest Hwy Unit 202
- 7005 N Osceola Ave
- 6841 N Northwest Hwy Unit 3C
- 6815 N Olmsted Ave Unit 203
- 7039 N Ottawa Ave
- 6852 N Northwest Hwy Unit 2B
- 6858 N Northwest Hwy Unit 2E
- 7315 W Lunt Ave
- 7324 W Lunt Ave
- 7101 N Ottawa Ave
- 7215 W Farwell Ave
- 460 S Northwest Hwy Unit 307A
- 400 S Northwest Hwy Unit 312B
- 6524 N Northwest Hwy Unit A
- 6500 N Northwest Hwy
- 7215 N Olcott Ave
- 6490 N Northwest Hwy Unit 3F
- 6833 N Oleander Ave
- 6841 N Oleander Ave
- 6831 N Oleander Ave
- 6829 N Oleander Ave
- 6845 N Oleander Ave
- 6849 N Oleander Ave
- 6821 N Oleander Ave
- 6821 N Oleander Ave
- 6836 N Olcott Ave
- 6830 N Olcott Ave
- 6840 N Olcott Ave
- 6826 N Olcott Ave
- 6855 N Oleander Ave
- 6844 N Olcott Ave
- 6815 N Oleander Ave
- 6822 N Olcott Ave
- 6836 N Oleander Ave
- 6838 N Oleander Ave
- 6840 N Oleander Ave
- 6830 N Oleander Ave