T
Seller's Agent in 2012
Ted Glover
Giovingo Properties
Estimated Value: $208,970 - $287,000
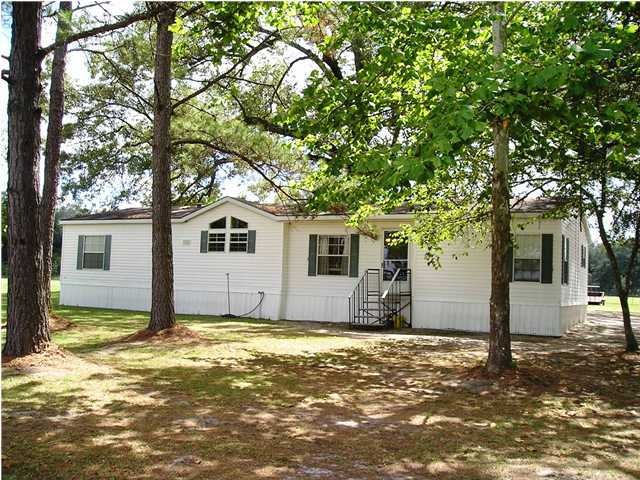
Mitchell County home with 10 acres a pond and fence pasture. A 3 bedroom 2 bath manufactured home in very well kept condition with plenty room for the family and entertaining. Call your agent to see this home.
Last Agent to Sell the Property
Ted Glover
Giovingo Properties Brokerage Phone: 2294356204 License #135282 Listed on: 01/27/2012
Last Buyer's Agent
Ted Glover
Giovingo Properties Brokerage Phone: 2294356204 License #135282 Listed on: 01/27/2012
| Date | Buyer | Sale Price | Title Company |
|---|---|---|---|
| Kilgore Harvey Dustin | $142,000 | -- | |
| Puzakulics Shelley A | $89,900 | -- | |
| Yarley Samuel | -- | -- |
| Date | Status | Borrower | Loan Amount |
|---|---|---|---|
| Open | Kilgore Harvey Dustin | $139,428 | |
| Previous Owner | Puzakulics Shelley A | $87,620 |
| Date | Event | Price | List to Sale | Price per Sq Ft |
|---|---|---|---|---|
| 03/20/2012 03/20/12 | Sold | $89,900 | -- | $47 / Sq Ft |
| 01/27/2012 01/27/12 | Pending | -- | -- | -- |
| Year | Tax Paid | Tax Assessment Tax Assessment Total Assessment is a certain percentage of the fair market value that is determined by local assessors to be the total taxable value of land and additions on the property. | Land | Improvement |
|---|---|---|---|---|
| 2024 | $1,528 | $53,580 | $13,520 | $40,060 |
| 2023 | $1,635 | $53,580 | $13,520 | $40,060 |
| 2022 | $1,530 | $43,980 | $13,520 | $30,460 |
| 2021 | $1,148 | $40,196 | $12,800 | $27,396 |
| 2020 | $1,146 | $40,196 | $12,800 | $27,396 |
| 2019 | $1,139 | $40,196 | $12,800 | $27,396 |
| 2018 | $1,422 | $39,036 | $11,640 | $27,396 |
| 2017 | $1,098 | $33,806 | $6,900 | $26,906 |
| 2016 | $984 | $32,906 | $6,900 | $26,006 |
| 2015 | $984 | $32,906 | $6,900 | $26,006 |
| 2014 | $984 | $32,906 | $6,900 | $26,006 |
| 2013 | $984 | $32,157 | $6,900 | $25,257 |
T
Seller's Agent in 2012
Ted Glover
Giovingo Properties
Source: Albany Board of REALTORS®
MLS Number: 125223
APN: 00580-005-000
