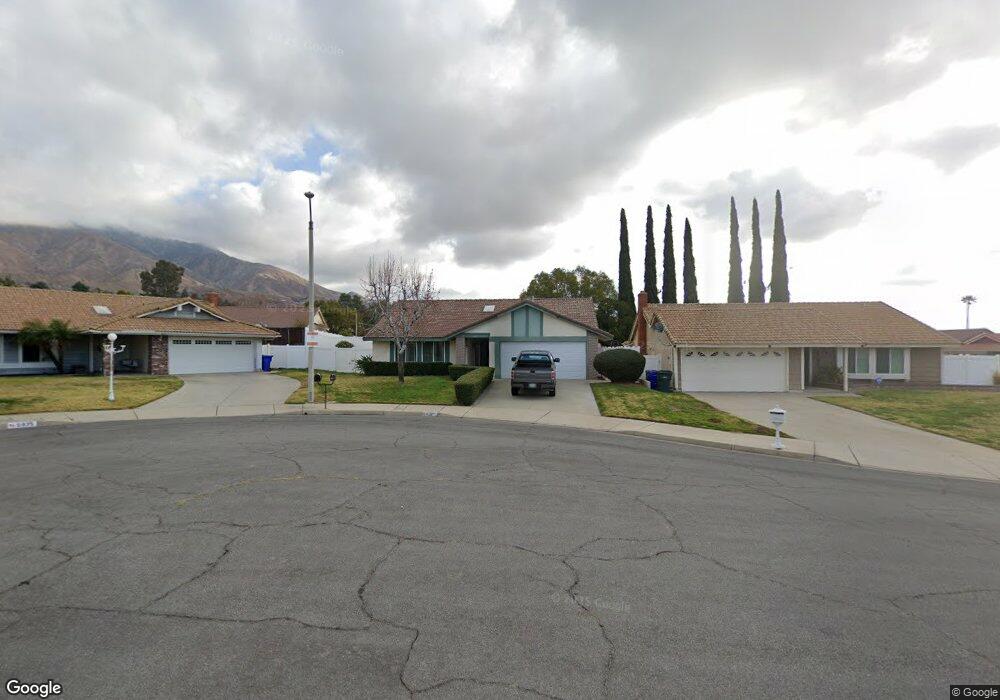
6839 Oleander Ave Highland, CA 92346
East Highlands NeighborhoodEstimated Value: $511,354 - $561,000
3
Beds
2
Baths
1,425
Sq Ft
$381/Sq Ft
Est. Value
About This Home
This home is located at 6839 Oleander Ave, Highland, CA 92346 and is currently estimated at $543,589, approximately $381 per square foot. 6839 Oleander Ave is a home located in San Bernardino County with nearby schools including Thompson Elementary School, Serrano Middle School, and San Gorgonio High School.
Ownership History
Date
Name
Owned For
Owner Type
Purchase Details
Closed on
Jul 15, 2025
Sold by
Okeefe Dennis J and Okeefe Charlotte A
Bought by
Family Trust and Okeefe
Current Estimated Value
Purchase Details
Closed on
Mar 7, 2000
Sold by
Brown Joyce Ann
Bought by
Okeefe Dennis J and Okeefe Charlotte A
Home Financials for this Owner
Home Financials are based on the most recent Mortgage that was taken out on this home.
Original Mortgage
$103,920
Interest Rate
8.38%
Purchase Details
Closed on
Apr 4, 1996
Sold by
Lindsey Cathryn G
Bought by
Lawrence D & Joye A Brown Family Trust
Purchase Details
Closed on
Apr 17, 1995
Sold by
Starbuck Scott R and Starbuck Elizabeth A
Bought by
Lindsey Cathryn G and Brown Lawrence D
Home Financials for this Owner
Home Financials are based on the most recent Mortgage that was taken out on this home.
Original Mortgage
$115,379
Interest Rate
8.77%
Mortgage Type
FHA
Create a Home Valuation Report for This Property
The Home Valuation Report is an in-depth analysis detailing your home's value as well as a comparison with similar homes in the area
Home Values in the Area
Average Home Value in this Area
Purchase History
| Date | Buyer | Sale Price | Title Company |
|---|---|---|---|
| Family Trust | -- | None Listed On Document | |
| Okeefe Dennis J | $130,000 | Fidelity National Title Co | |
| Lawrence D & Joye A Brown Family Trust | -- | -- | |
| Lindsey Cathryn G | $116,000 | Orange Coast Title Co |
Source: Public Records
Mortgage History
| Date | Status | Borrower | Loan Amount |
|---|---|---|---|
| Previous Owner | Okeefe Dennis J | $103,920 | |
| Previous Owner | Lindsey Cathryn G | $115,379 |
Source: Public Records
Tax History
| Year | Tax Paid | Tax Assessment Tax Assessment Total Assessment is a certain percentage of the fair market value that is determined by local assessors to be the total taxable value of land and additions on the property. | Land | Improvement |
|---|---|---|---|---|
| 2025 | $2,775 | $199,657 | $50,722 | $148,935 |
| 2024 | $2,716 | $195,742 | $49,727 | $146,015 |
| 2023 | $2,656 | $191,904 | $48,752 | $143,152 |
| 2022 | $2,656 | $188,141 | $47,796 | $140,345 |
| 2021 | $2,626 | $184,452 | $46,859 | $137,593 |
| 2020 | $2,622 | $182,561 | $46,379 | $136,182 |
| 2019 | $2,533 | $178,982 | $45,470 | $133,512 |
| 2018 | $2,501 | $175,472 | $44,578 | $130,894 |
| 2017 | $2,179 | $172,031 | $43,704 | $128,327 |
| 2016 | $2,113 | $168,658 | $42,847 | $125,811 |
| 2015 | $2,151 | $166,124 | $42,203 | $123,921 |
| 2014 | $2,091 | $162,870 | $41,376 | $121,494 |
Source: Public Records
Map
Nearby Homes
- 28046 Millar St
- 27989 Pacific St
- 28261 Cornus Ct
- 1634 Seine Ave
- 6886 Country Oaks Dr
- 1614 Buckeye St
- 0 La Praix St
- 7079 Cienega Dr
- 7001 Church Ave Unit 15
- 0 Baseline St Unit CV25136921
- 27631 Villa Ave
- 6986 Church Ave
- 27611 Villa Ave
- 27540 14th St
- 3850 Atlantic Ave Unit 287
- 3850 Atlantic Ave Unit 158
- 3850 Atlantic Ave Unit 151
- 3850 Atlantic Ave Unit 189
- 3850 Atlantic Ave Unit 152
- 3850 E Atlantic Unit 284
- 6849 Oleander Ave
- 6835 Oleander Ave
- 6812 Grove Ave
- 6826 Grove Ave
- 6804 Grove Ave
- 6830 Oleander Ave
- 28035 Nona Ave
- 6846 Oleander Ave
- 6838 Oleander Ave
- 28047 Nona Ave
- 6834 Oleander Ave
- 28025 Nona Ave
- 28039 Pasito St
- 28029 Pasito St
- 28049 Pasito St
- 28013 Nona Ave
- 28019 Pasito St
- 28057 Pasito St
- 6841 Laurel Ave
- 28009 Pasito St
Your Personal Tour Guide
Ask me questions while you tour the home.