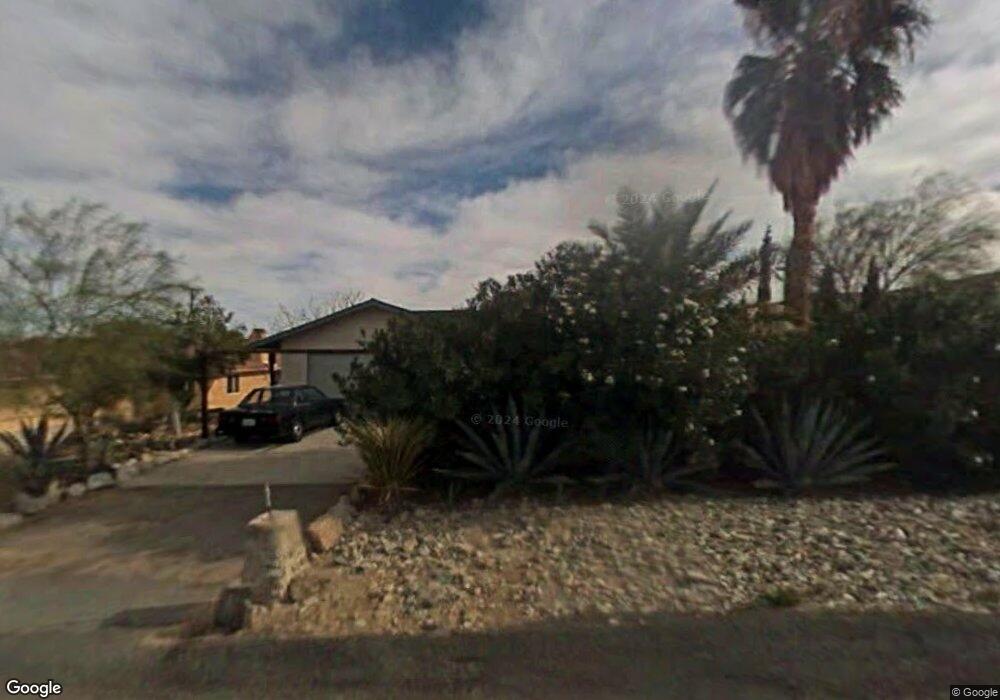
6839 Quail Spring Ave Twentynine Palms, CA 92277
Estimated Value: $250,938 - $314,000
2
Beds
1
Bath
897
Sq Ft
$313/Sq Ft
Est. Value
About This Home
This home is located at 6839 Quail Spring Ave, Twentynine Palms, CA 92277 and is currently estimated at $280,985, approximately $313 per square foot. 6839 Quail Spring Ave is a home located in San Bernardino County with nearby schools including Oasis Elementary School, Twentynine Palms Junior High School, and Twentynine Palms High School.
Ownership History
Date
Name
Owned For
Owner Type
Purchase Details
Closed on
Sep 16, 2005
Sold by
Rimmington Thomas Campbell
Bought by
Cutler Scott G and Cutler Lisa S
Current Estimated Value
Home Financials for this Owner
Home Financials are based on the most recent Mortgage that was taken out on this home.
Original Mortgage
$147,682
Interest Rate
5.97%
Mortgage Type
FHA
Purchase Details
Closed on
Sep 1, 2001
Sold by
Rimmington Sidney T and Rimmington Patricia E
Bought by
Rimmington Thomas Campbell
Purchase Details
Closed on
Sep 6, 2000
Sold by
Rikovsky Jean P
Bought by
Rimmington Thomas Campbell
Home Financials for this Owner
Home Financials are based on the most recent Mortgage that was taken out on this home.
Original Mortgage
$51,000
Interest Rate
7.98%
Mortgage Type
VA
Create a Home Valuation Report for This Property
The Home Valuation Report is an in-depth analysis detailing your home's value as well as a comparison with similar homes in the area
Home Values in the Area
Average Home Value in this Area
Purchase History
| Date | Buyer | Sale Price | Title Company |
|---|---|---|---|
| Cutler Scott G | $150,000 | New Century Title Company | |
| Rimmington Thomas Campbell | -- | Fidelity National Title | |
| Rimmington Thomas Campbell | $50,000 | Fidelity National Title |
Source: Public Records
Mortgage History
| Date | Status | Borrower | Loan Amount |
|---|---|---|---|
| Previous Owner | Cutler Scott G | $147,682 | |
| Previous Owner | Rimmington Thomas Campbell | $51,000 |
Source: Public Records
Tax History Compared to Growth
Tax History
| Year | Tax Paid | Tax Assessment Tax Assessment Total Assessment is a certain percentage of the fair market value that is determined by local assessors to be the total taxable value of land and additions on the property. | Land | Improvement |
|---|---|---|---|---|
| 2025 | $2,640 | $204,989 | $20,499 | $184,490 |
| 2024 | $2,640 | $200,970 | $20,097 | $180,873 |
| 2023 | $2,557 | $197,029 | $19,703 | $177,326 |
| 2022 | $2,500 | $193,166 | $19,317 | $173,849 |
| 2021 | $1,906 | $136,000 | $34,000 | $102,000 |
| 2020 | $1,660 | $113,400 | $27,800 | $85,600 |
| 2019 | $1,557 | $106,000 | $26,000 | $80,000 |
| 2018 | $1,394 | $91,900 | $23,500 | $68,400 |
| 2017 | $1,330 | $85,900 | $22,000 | $63,900 |
| 2016 | $1,272 | $81,100 | $20,800 | $60,300 |
| 2015 | $1,161 | $78,000 | $20,000 | $58,000 |
| 2014 | $1,074 | $69,000 | $17,000 | $52,000 |
Source: Public Records
Map
Nearby Homes
- 0 Ivanpah Ave Unit CV25172617
- 6789 Copper Mountain Rd
- 6646 Quail Spring Ave
- 69235 Old Dale Rd
- 6548 Quail Spring Ave
- 111 S 29 Palms Outer Hwy
- 207 Indian Cir
- 29 Palms Hwy
- 6425 Indian Cove Rd
- 68054 Sullivan Rd
- 5440 Shoshone Valley Rd
- 5400 Shoshone Valley Rd
- 2.5 Acres On Hwy 62 Near Kern Blvd
- 2.5 Acres On Hwy 62 Near Hendy's Rd
- 70138 Sullivan Rd
- 11 Indian Cove Rd
- 12 Indian Cove Rd
- 6976 Sherman Rd
- 0 Mantonya Rd Unit WS25144506
- 6829 Quail Spring Ave
- 6851 Quail Spring Ave
- 6601 Quail Spring Ave
- 1 Quail Spring Ave
- 6840 Indian Cove Rd
- 6817 Quail Spring Ave
- 6859 Quail Spring Ave
- 6830 Indian Cove Rd
- 6838 Quail Spring Ave
- 6826 Quail Spring Ave
- 6848 Quail Spring Ave
- 6818 Indian Cove Rd
- 6862 Indian Cove Rd
- 6871 Quail Spring Ave
- 6886 Indian Cove Rd
- 6814 Quail Spring Ave
- 6860 Quail Spring Ave
- 6806 Indian Cove Rd
- 0 Quail Spring Ave Unit JT18129363
- 0 Quail Springs Ave Unit DC21130461