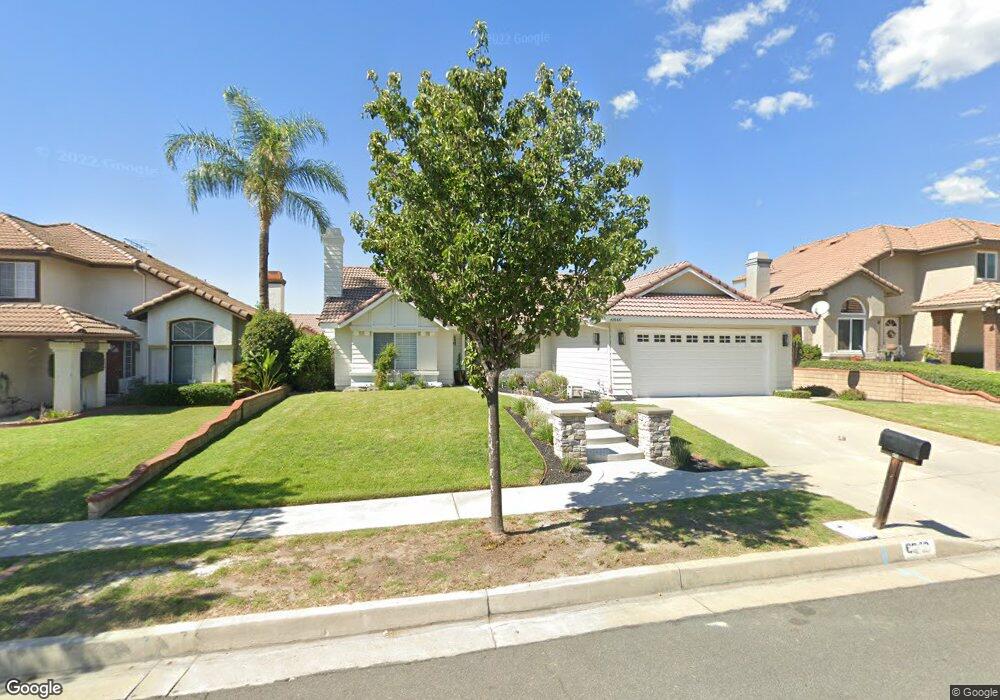
6840 Trinity Place Rancho Cucamonga, CA 91701
Estimated Value: $774,337 - $1,052,000
3
Beds
2
Baths
1,607
Sq Ft
$545/Sq Ft
Est. Value
About This Home
This home is located at 6840 Trinity Place, Rancho Cucamonga, CA 91701 and is currently estimated at $876,084, approximately $545 per square foot. 6840 Trinity Place is a home located in San Bernardino County with nearby schools including Victoria Groves Elementary, Vineyard Junior High, and Los Osos High.
Ownership History
Date
Name
Owned For
Owner Type
Purchase Details
Closed on
Feb 28, 2002
Sold by
Watson Francis
Bought by
Mcreynolds Natalie C
Current Estimated Value
Home Financials for this Owner
Home Financials are based on the most recent Mortgage that was taken out on this home.
Original Mortgage
$183,200
Interest Rate
6.43%
Purchase Details
Closed on
Dec 6, 2000
Sold by
Klingelberg Kenton F
Bought by
Watson Francis and Watson Kiyoko
Home Financials for this Owner
Home Financials are based on the most recent Mortgage that was taken out on this home.
Original Mortgage
$167,150
Interest Rate
7.71%
Purchase Details
Closed on
Sep 3, 1993
Sold by
Thorne Michael J
Bought by
Klingelberg Kenton F and Klingelberg Nancy L
Create a Home Valuation Report for This Property
The Home Valuation Report is an in-depth analysis detailing your home's value as well as a comparison with similar homes in the area
Home Values in the Area
Average Home Value in this Area
Purchase History
| Date | Buyer | Sale Price | Title Company |
|---|---|---|---|
| Mcreynolds Natalie C | $229,000 | First American Title | |
| Watson Francis | $197,000 | First American Title Ins Co | |
| Klingelberg Kenton F | $167,000 | Old Republic Title Company |
Source: Public Records
Mortgage History
| Date | Status | Borrower | Loan Amount |
|---|---|---|---|
| Previous Owner | Mcreynolds Natalie C | $183,200 | |
| Previous Owner | Watson Francis | $167,150 |
Source: Public Records
Tax History Compared to Growth
Tax History
| Year | Tax Paid | Tax Assessment Tax Assessment Total Assessment is a certain percentage of the fair market value that is determined by local assessors to be the total taxable value of land and additions on the property. | Land | Improvement |
|---|---|---|---|---|
| 2025 | $3,850 | $331,671 | $82,918 | $248,753 |
| 2024 | $3,850 | $325,167 | $81,292 | $243,875 |
| 2023 | $3,759 | $318,791 | $79,698 | $239,093 |
| 2022 | $3,739 | $312,540 | $78,135 | $234,405 |
| 2021 | $3,736 | $306,412 | $76,603 | $229,809 |
| 2020 | $3,594 | $303,271 | $75,818 | $227,453 |
| 2019 | $3,630 | $297,324 | $74,331 | $222,993 |
| 2018 | $3,554 | $291,495 | $72,874 | $218,621 |
| 2017 | $3,405 | $285,779 | $71,445 | $214,334 |
| 2016 | $3,319 | $280,175 | $70,044 | $210,131 |
| 2015 | $3,299 | $275,967 | $68,992 | $206,975 |
| 2014 | $3,220 | $270,562 | $67,641 | $202,921 |
Source: Public Records
Map
Nearby Homes
- 6915 Stanislaus Place
- 6842 Palm Dr
- 6831 Valinda Ave
- 11027 Furman Ct
- 10781 La Vine St
- 11017 Piedmont St
- 7055 Mango St
- 6572 San Benito Ave
- 10980 Santa Barbara Place
- 6516 Alameda Ave
- 10672 Finch Ave
- 6886 Cabrini Ct
- 7224 Parkside Place
- 10456 Hamilton St
- 6792 Galveston Place
- 11253 Drake St
- 11266 Gannon St
- 6979 Walker Ct
- 10655 Lemon Ave Unit 3613
- 10655 Lemon Ave Unit 3808
- 6830 Trinity Place
- 6850 Trinity Place
- 6835 Nevada Ct
- 6847 Nevada Ct
- 6820 Trinity Place
- 6860 Trinity Place
- 6825 Nevada Ct
- 6857 Nevada Ct
- 10820 Yuba Ct
- 10821 Colusa St
- 6810 Trinity Place
- 6815 Nevada Ct
- 6867 Nevada Ct
- 6874 Trinity Place
- 10830 Yuba Ct
- 6865 Trinity Place
- 10831 Colusa St
- 6884 Trinity Place
- 6800 Trinity Place
- 6844 Nevada Ct