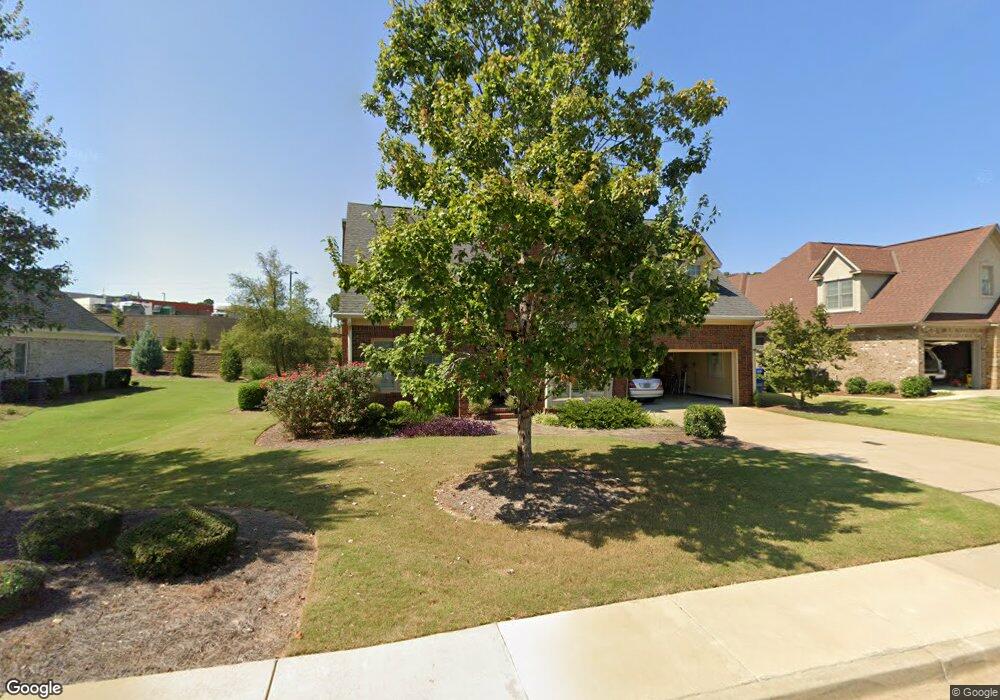
6841 Riverbrook Trace Columbus, GA 31904
Estimated Value: $424,871 - $459,000
3
Beds
3
Baths
2,868
Sq Ft
$154/Sq Ft
Est. Value
About This Home
This home is located at 6841 Riverbrook Trace, Columbus, GA 31904 and is currently estimated at $441,968, approximately $154 per square foot. 6841 Riverbrook Trace is a home located in Muscogee County with nearby schools including Double Churches Elementary School, Double Churches Middle School, and Northside High School.
Ownership History
Date
Name
Owned For
Owner Type
Purchase Details
Closed on
Mar 2, 2025
Sold by
Vassar Matty Leigh
Bought by
Matty Leigh Vassar and Armstrong Chelsey Seawell
Current Estimated Value
Purchase Details
Closed on
Jan 12, 2012
Sold by
Matty Ronald E
Bought by
Vassar Matty Ronald E and Vassar Matty Leigh
Purchase Details
Closed on
Nov 23, 2010
Sold by
Jim Mcclung Builder Inc
Bought by
Matty Ronald E
Home Financials for this Owner
Home Financials are based on the most recent Mortgage that was taken out on this home.
Original Mortgage
$207,500
Interest Rate
2.75%
Mortgage Type
New Conventional
Purchase Details
Closed on
May 27, 2010
Sold by
Wwam Inc
Bought by
Jim Mcclung Builder Inc
Home Financials for this Owner
Home Financials are based on the most recent Mortgage that was taken out on this home.
Original Mortgage
$246,000
Interest Rate
5.03%
Mortgage Type
Purchase Money Mortgage
Create a Home Valuation Report for This Property
The Home Valuation Report is an in-depth analysis detailing your home's value as well as a comparison with similar homes in the area
Home Values in the Area
Average Home Value in this Area
Purchase History
| Date | Buyer | Sale Price | Title Company |
|---|---|---|---|
| Matty Leigh Vassar | -- | None Listed On Document | |
| Vassar Matty Ronald E | -- | -- | |
| Matty Ronald E | $307,500 | None Available | |
| Jim Mcclung Builder Inc | $50,000 | None Available |
Source: Public Records
Mortgage History
| Date | Status | Borrower | Loan Amount |
|---|---|---|---|
| Previous Owner | Matty Ronald E | $207,500 | |
| Previous Owner | Jim Mcclung Builder Inc | $246,000 |
Source: Public Records
Tax History Compared to Growth
Tax History
| Year | Tax Paid | Tax Assessment Tax Assessment Total Assessment is a certain percentage of the fair market value that is determined by local assessors to be the total taxable value of land and additions on the property. | Land | Improvement |
|---|---|---|---|---|
| 2025 | $430 | $160,012 | $22,008 | $138,004 |
| 2024 | $4,298 | $160,012 | $22,008 | $138,004 |
| 2023 | $3,630 | $160,012 | $22,008 | $138,004 |
| 2022 | $4,482 | $131,564 | $22,008 | $109,556 |
| 2021 | $4,475 | $118,628 | $22,008 | $96,620 |
| 2020 | $4,477 | $118,628 | $22,008 | $96,620 |
| 2019 | $4,493 | $118,628 | $22,008 | $96,620 |
| 2018 | $4,493 | $118,628 | $22,008 | $96,620 |
| 2017 | $4,509 | $118,628 | $22,008 | $96,620 |
| 2016 | $4,526 | $127,795 | $23,200 | $104,595 |
| 2015 | $4,526 | $127,795 | $23,200 | $104,595 |
| 2014 | $4,526 | $127,795 | $23,200 | $104,595 |
| 2013 | -- | $127,795 | $23,200 | $104,595 |
Source: Public Records
Map
Nearby Homes
- 239 Clearbrook Ln
- 223 Pebblebrook Ln
- 235 Pebblebrook Ln
- 7015 Spring Walk Dr
- 7044 Spring Walk Dr
- 280 Zachary Ct
- 252 Woodstream Dr
- 308 Woodstream Dr
- 264 Woodstream Dr
- 6688 Creekview Place
- 315 Woodstream Dr
- 319 Woodstream Dr
- 7020 Redwood Dr
- 6390 Cape Cod Dr
- 152 & 206 Willett Dr
- 6619 Woodberry Rd
- 6500 Standing Boy Rd Unit 6
- 6528 Standing Boy Rd
- 5 Bridgecreek Ct
- 6333 Cape Cod Dr
- 6847 Riverbrook Trace
- 6835 Riverbrook Trace
- 6853 Riverbrook Trace
- 6827 Riverbrook Trace
- 6824 Riverbrook Trace
- 6818 Riverbrook Trace
- 168 Pebblebrook Ln
- 6859 Riverbrook Trace
- 6806 Riverbrook Trace
- 6819 Riverbrook Trace
- 0 Pebblebrook Ln Unit 7543252
- 0 Pebblebrook Ln Unit 8796090
- 0 Pebblebrook Ln Unit 7581520
- 0 Pebblebrook Ln
- 174 Pebblebrook Ln
- 6885 Shadybrook Trail
- 6800 Riverbrook Trace
- 169 Pebblebrook Ln
- 6901 Riverbrook Trace
- 6873 Shadybrook Trail