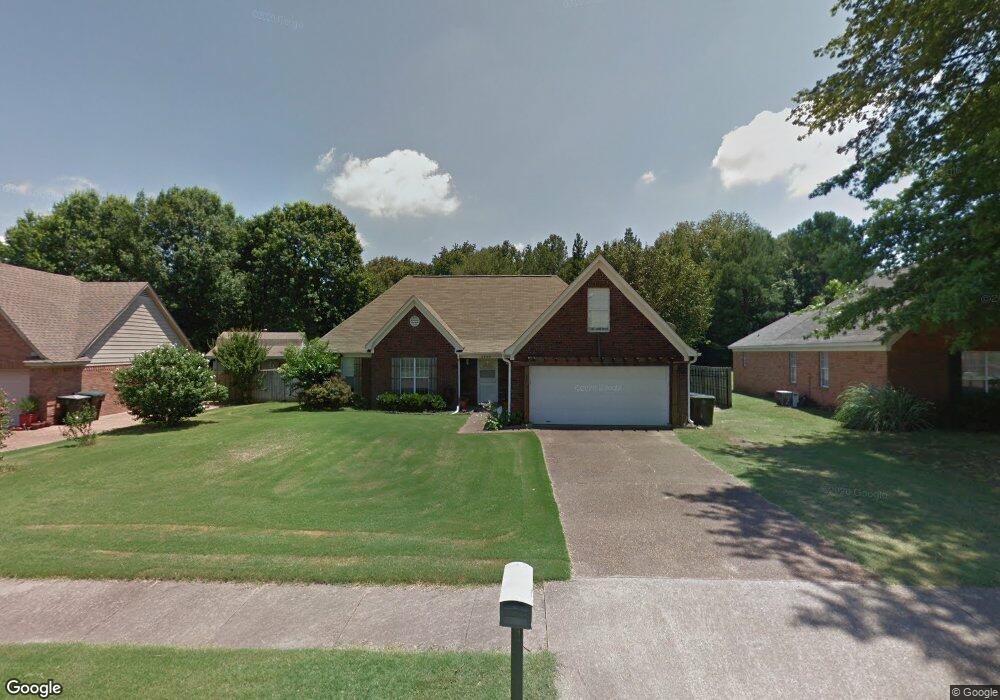
6849 Andrews Rd Memphis, TN 38135
Estimated Value: $318,492 - $336,000
3
Beds
2
Baths
2,312
Sq Ft
$142/Sq Ft
Est. Value
About This Home
This home is located at 6849 Andrews Rd, Memphis, TN 38135 and is currently estimated at $328,623, approximately $142 per square foot. 6849 Andrews Rd is a home located in Shelby County with nearby schools including Oak Elementary School, Appling Middle School, and Bartlett High School.
Ownership History
Date
Name
Owned For
Owner Type
Purchase Details
Closed on
Mar 16, 2012
Sold by
Robinson Ronald A
Bought by
Robinson Deirdre R
Current Estimated Value
Purchase Details
Closed on
Apr 29, 2011
Sold by
Blankenship Cindy and Gibson Anne
Bought by
Robinson Ronald A
Home Financials for this Owner
Home Financials are based on the most recent Mortgage that was taken out on this home.
Original Mortgage
$145,222
Outstanding Balance
$98,408
Interest Rate
4.5%
Mortgage Type
FHA
Estimated Equity
$230,215
Purchase Details
Closed on
Jan 17, 2003
Sold by
Davis Deanne and Moore Kimberly
Bought by
Blankenship Hubert L and Blankenship Mary Ruth
Home Financials for this Owner
Home Financials are based on the most recent Mortgage that was taken out on this home.
Original Mortgage
$120,000
Interest Rate
4.75%
Purchase Details
Closed on
Feb 6, 1998
Sold by
Deanne Davis
Bought by
Davis Deanne and Moore Kimberly
Home Financials for this Owner
Home Financials are based on the most recent Mortgage that was taken out on this home.
Original Mortgage
$113,000
Interest Rate
7.07%
Purchase Details
Closed on
Aug 29, 1995
Bought by
Garner David F and Garner Debra A
Create a Home Valuation Report for This Property
The Home Valuation Report is an in-depth analysis detailing your home's value as well as a comparison with similar homes in the area
Home Values in the Area
Average Home Value in this Area
Purchase History
| Date | Buyer | Sale Price | Title Company |
|---|---|---|---|
| Robinson Deirdre R | -- | Multiple | |
| Robinson Ronald A | $149,000 | Multiple | |
| Blankenship Hubert L | $139,000 | -- | |
| Davis Deanne | -- | Southern Escrow Title Compan | |
| Davis Deanne | -- | Southern Escrow Title Compan | |
| Garner David F | $115,600 | -- |
Source: Public Records
Mortgage History
| Date | Status | Borrower | Loan Amount |
|---|---|---|---|
| Open | Robinson Ronald A | $145,222 | |
| Previous Owner | Blankenship Hubert L | $120,000 | |
| Previous Owner | Davis Deanne | $113,000 |
Source: Public Records
Tax History
| Year | Tax Paid | Tax Assessment Tax Assessment Total Assessment is a certain percentage of the fair market value that is determined by local assessors to be the total taxable value of land and additions on the property. | Land | Improvement |
|---|---|---|---|---|
| 2025 | $1,964 | $84,450 | $14,500 | $69,950 |
| 2024 | $1,964 | $57,925 | $9,750 | $48,175 |
| 2023 | $2,966 | $57,925 | $9,750 | $48,175 |
| 2022 | $2,966 | $57,925 | $9,750 | $48,175 |
| 2021 | $2,900 | $52,275 | $9,750 | $42,525 |
| 2020 | $2,339 | $39,775 | $7,500 | $32,275 |
| 2019 | $2,339 | $39,775 | $7,500 | $32,275 |
| 2018 | $2,339 | $39,775 | $7,500 | $32,275 |
| 2017 | $1,635 | $39,775 | $7,500 | $32,275 |
| 2016 | $1,533 | $35,075 | $0 | $0 |
| 2014 | $1,533 | $35,075 | $0 | $0 |
Source: Public Records
Map
Nearby Homes
- 6885 Tiffany Oaks Cove
- 6895 Tiffany Oaks Cove
- 6913 Tiffany Oaks Cove
- 6957 Andrews Rd
- 6613 Baird Cove
- 6774 Oakmoor Cir S
- 3334 Oak Rd
- 6593 Woodpark Ln
- 3255 Oak Cove
- 6631 Morningsgate Cove
- 6569 Woodpark Cove
- 3618 Sunray Cove
- 6644 Bright Star Ln
- 7185 Deerfield Rd
- 3466 Stone Chase Cove
- 6561 Deermont Dr
- 6884 Johnstown Ln
- 6963 Fairhill Ln
- 3262 W Earhart Dr
- 6918 Talcott Ln
- 6845 Andrews Rd
- 6853 Andrews Rd
- 3459 Elkfield Cove
- 6841 Andrews Rd
- 6859 Andrews Rd
- 6850 Andrews Rd
- 6907 Doefield Trail
- 3493 Tiffany Oaks Ln
- 6838 Andrews Rd
- 3453 Elkfield Cove
- 6831 Andrews Rd
- 6832 Andrews Rd
- 6831 Nicole Cove
- 6892 Doefield Trail
- 3501 Tiffany Oaks Ln
- 6900 Doefield Trail
- 6825 Nicole Cove
- 3494 Tiffany Oaks Ln
- 6910 Doefield Trail
- 6827 Andrews Rd
Your Personal Tour Guide
Ask me questions while you tour the home.