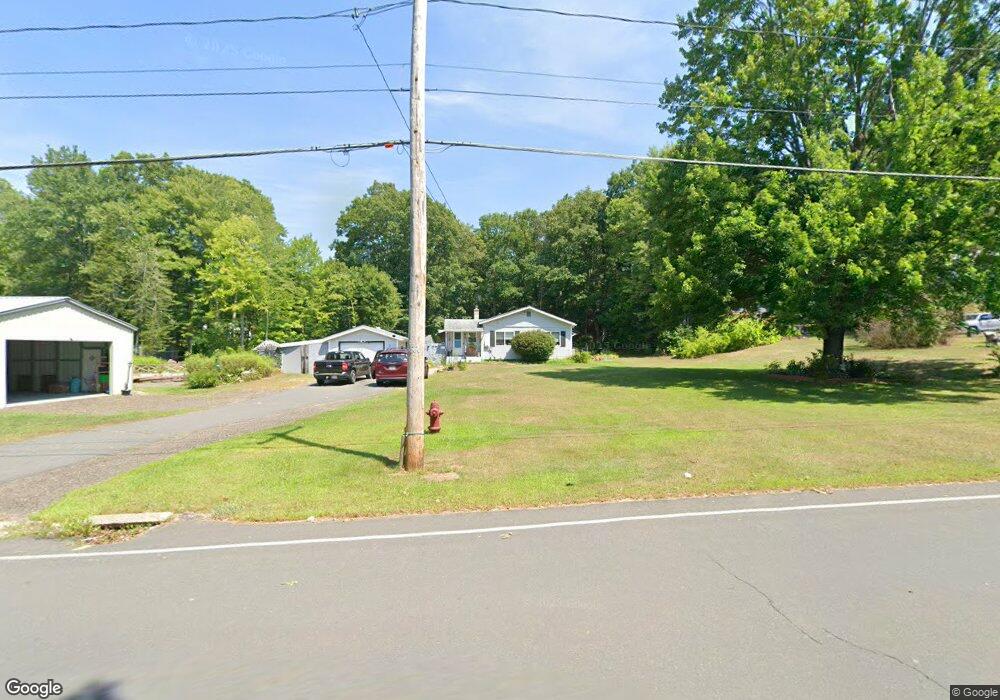
685 E Main St Orange, MA 01364
Estimated Value: $273,000 - $309,000
2
Beds
1
Bath
1,078
Sq Ft
$271/Sq Ft
Est. Value
About This Home
This home is located at 685 E Main St, Orange, MA 01364 and is currently estimated at $291,894, approximately $270 per square foot. 685 E Main St is a home located in Franklin County with nearby schools including Fisher Hill and Ralph C Mahar Regional School.
Ownership History
Date
Name
Owned For
Owner Type
Purchase Details
Closed on
Nov 17, 2021
Sold by
Royal Dev Projects Llc
Bought by
Duel Lois L and Duel Debbi Jo
Current Estimated Value
Purchase Details
Closed on
May 30, 2003
Sold by
Est Vorce Cedar O
Bought by
Duel Lois L
Create a Home Valuation Report for This Property
The Home Valuation Report is an in-depth analysis detailing your home's value as well as a comparison with similar homes in the area
Home Values in the Area
Average Home Value in this Area
Purchase History
| Date | Buyer | Sale Price | Title Company |
|---|---|---|---|
| Duel Lois L | $37,000 | None Available | |
| Duel Lois L | $100,000 | -- |
Source: Public Records
Mortgage History
| Date | Status | Borrower | Loan Amount |
|---|---|---|---|
| Previous Owner | Duel Lois L | $25,000 | |
| Previous Owner | Duel Lois L | $95,000 | |
| Previous Owner | Duel Lois L | $99,000 |
Source: Public Records
Tax History
| Year | Tax Paid | Tax Assessment Tax Assessment Total Assessment is a certain percentage of the fair market value that is determined by local assessors to be the total taxable value of land and additions on the property. | Land | Improvement |
|---|---|---|---|---|
| 2025 | $38 | $234,000 | $31,600 | $202,400 |
| 2024 | $3,479 | $199,500 | $31,600 | $167,900 |
| 2023 | $3,341 | $186,000 | $31,600 | $154,400 |
| 2022 | $2,904 | $151,900 | $31,600 | $120,300 |
| 2021 | $3,050 | $152,100 | $44,600 | $107,500 |
| 2020 | $2,966 | $145,900 | $42,600 | $103,300 |
| 2019 | $2,727 | $121,100 | $38,100 | $83,000 |
| 2018 | $2,585 | $117,800 | $36,900 | $80,900 |
| 2017 | $2,501 | $117,800 | $36,900 | $80,900 |
| 2016 | $2,493 | $114,900 | $36,900 | $78,000 |
| 2015 | $2,193 | $105,600 | $32,800 | $72,800 |
| 2014 | $2,041 | $103,400 | $28,700 | $74,700 |
Source: Public Records
Map
Nearby Homes
Your Personal Tour Guide
Ask me questions while you tour the home.