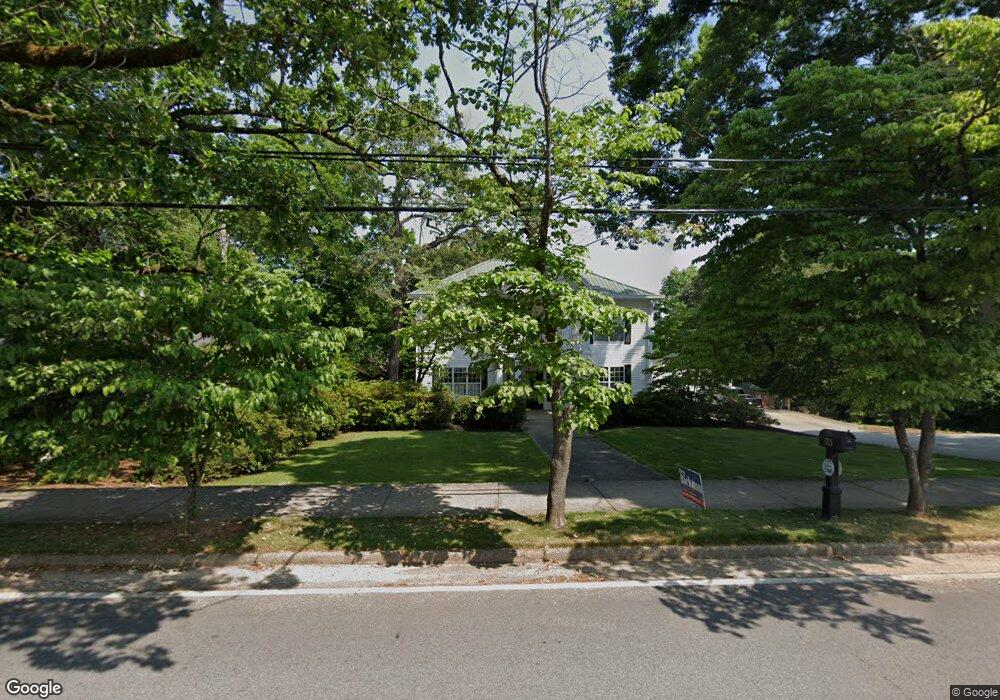
685 E Tugalo St Toccoa, GA 30577
Estimated Value: $490,000 - $619,000
4
Beds
5
Baths
5,372
Sq Ft
$103/Sq Ft
Est. Value
About This Home
This home is located at 685 E Tugalo St, Toccoa, GA 30577 and is currently estimated at $552,740, approximately $102 per square foot. 685 E Tugalo St is a home located in Stephens County with nearby schools including Stephens County High School.
Ownership History
Date
Name
Owned For
Owner Type
Purchase Details
Closed on
Nov 23, 2020
Sold by
Rickman Christopher D
Bought by
Arrowood Thomas Alvin and Arrowood Rachel Elizabeth
Current Estimated Value
Home Financials for this Owner
Home Financials are based on the most recent Mortgage that was taken out on this home.
Original Mortgage
$80,000
Outstanding Balance
$55,126
Interest Rate
2.8%
Mortgage Type
New Conventional
Estimated Equity
$497,614
Purchase Details
Closed on
Mar 31, 2017
Sold by
Ashe Geoffrey A
Bought by
Rickman Christopher D and Rickman Erin M
Home Financials for this Owner
Home Financials are based on the most recent Mortgage that was taken out on this home.
Original Mortgage
$263,532
Interest Rate
3.75%
Mortgage Type
FHA
Purchase Details
Closed on
Feb 8, 2006
Sold by
Ashe Kimberly
Bought by
Ashe Geoffrey A
Purchase Details
Closed on
Jan 1, 1997
Bought by
<Buyer Info Not Present>
Purchase Details
Closed on
Dec 1, 1980
Bought by
<Buyer Info Not Present>
Create a Home Valuation Report for This Property
The Home Valuation Report is an in-depth analysis detailing your home's value as well as a comparison with similar homes in the area
Purchase History
| Date | Buyer | Sale Price | Title Company |
|---|---|---|---|
| Arrowood Thomas Alvin | $349,900 | -- | |
| Rickman Christopher D | $277,000 | -- | |
| Ashe Geoffrey A | -- | -- | |
| <Buyer Info Not Present> | $28,500 | -- | |
| <Buyer Info Not Present> | $35,000 | -- |
Source: Public Records
Mortgage History
| Date | Status | Borrower | Loan Amount |
|---|---|---|---|
| Open | Arrowood Thomas Alvin | $80,000 | |
| Previous Owner | Rickman Christopher D | $263,532 |
Source: Public Records
Tax History
| Year | Tax Paid | Tax Assessment Tax Assessment Total Assessment is a certain percentage of the fair market value that is determined by local assessors to be the total taxable value of land and additions on the property. | Land | Improvement |
|---|---|---|---|---|
| 2025 | $6,812 | $236,905 | $6,366 | $230,539 |
| 2024 | $5,315 | $150,804 | $6,366 | $144,438 |
| 2023 | $4,892 | $139,990 | $6,366 | $133,624 |
| 2022 | $3,868 | $131,938 | $6,366 | $125,572 |
| 2021 | $3,905 | $126,880 | $6,366 | $120,514 |
| 2020 | $3,324 | $105,259 | $6,366 | $98,893 |
| 2019 | $3,300 | $104,056 | $6,366 | $97,690 |
| 2018 | $3,300 | $104,056 | $6,366 | $97,690 |
| 2017 | $3,360 | $104,304 | $6,366 | $97,938 |
| 2016 | $2,433 | $76,739 | $6,366 | $70,373 |
| 2015 | $2,587 | $77,886 | $6,366 | $71,520 |
| 2014 | $2,629 | $77,886 | $6,366 | $71,520 |
| 2013 | -- | $77,886 | $6,366 | $71,520 |
Source: Public Records
Map
Nearby Homes
- 22 Green Hill Place
- 84 Oak Creek Cir
- 1168 Rosedale St
- 100 Forest Ave
- 45 Hayes St
- 899 E Doyle St
- 345 Prather Bridge Rd
- 43 Mountain View Dr
- 239 E Doyle St
- 29 Mountain View Dr
- 109 Schaefer Ct
- 0 Hwy 17 Alt Unit 10577119
- 90 Elm Dr
- 73 Ridgeview Heights
- 41 Norwood Ave
- 30 Moore Ave
- 288 Davis Ave
- 148 Moreland Dr
- 59 Sunset Ln
- 117 Glencrest Dr
- 0 Cane Brake Cir Unit LOT 14 3222247
- 0 Cane Brake Cir Unit L5 3282366
- 0 Cane Brake Cir Unit LOT 14 7267414
- 0 Cane Brake Cir Unit LOT 14 7496993
- 0 Cane Brake Cir Unit 7&8 9002400
- 667 E Tugalo St
- 667 E Tugalo St Unit Lot 1 Block 3
- 707 E Tugalo St
- 40 Pauline St
- 528 E Tugalo St
- 723 E Tugalo St
- 56 Pauline St
- 641 E Tugalo St
- 0 Toccoa By Pass 17 Unit 8254970
- 0 The View Unit LOT 5 3188708
- 0 The View Unit LOT 1 3196595
- 0 The View Unit LOT 5 3282192
- 0 The View Unit LOT 1 7116987
- 0 The View Unit LOT 5 7206376
- 0 The View Unit LOT3 7352980
Your Personal Tour Guide
Ask me questions while you tour the home.