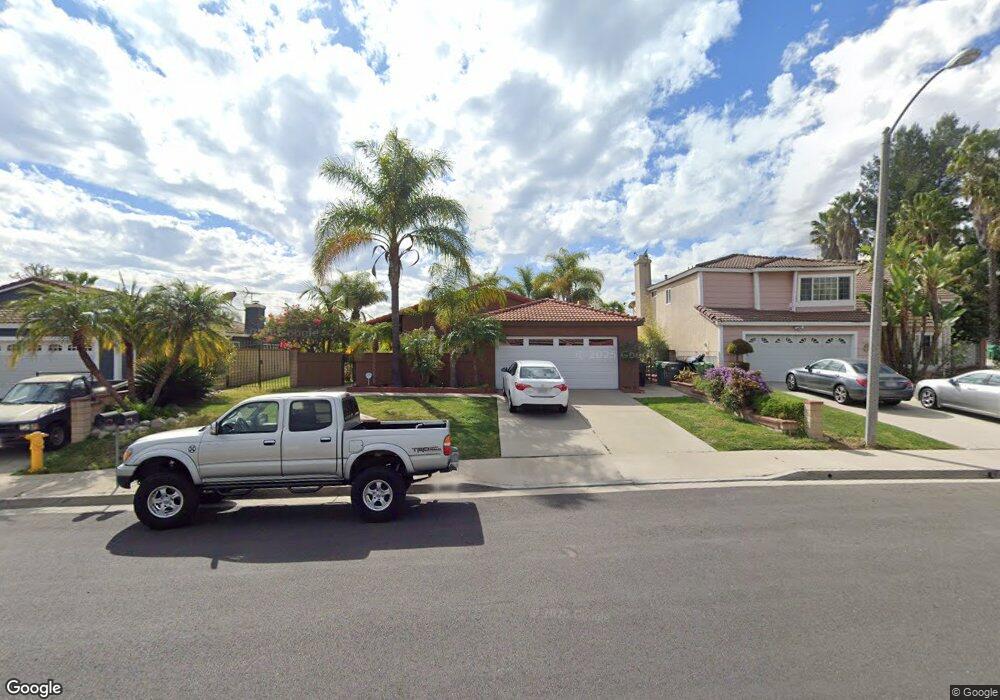
685 Featherwood Dr Diamond Bar, CA 91765
Estimated Value: $927,000 - $1,104,000
3
Beds
2
Baths
1,902
Sq Ft
$547/Sq Ft
Est. Value
About This Home
This home is located at 685 Featherwood Dr, Diamond Bar, CA 91765 and is currently estimated at $1,041,141, approximately $547 per square foot. 685 Featherwood Dr is a home located in Los Angeles County with nearby schools including Diamond Point Elementary School, Golden Springs Elementary School, and Lorbeer Middle School.
Ownership History
Date
Name
Owned For
Owner Type
Purchase Details
Closed on
Nov 28, 2012
Sold by
Wang Kenny Kien and Wang Tracy Ly
Bought by
Wang Kenny Kien and Wang Tracy Ly
Current Estimated Value
Purchase Details
Closed on
Mar 14, 2003
Sold by
Wang Kenny Kien and Wang Tracy Ly
Bought by
Wang Kenny Kien and Wang Tracy Ly
Home Financials for this Owner
Home Financials are based on the most recent Mortgage that was taken out on this home.
Original Mortgage
$163,000
Interest Rate
5.82%
Purchase Details
Closed on
May 28, 1999
Sold by
Hovsepian Varkez and Hovsepian Avanes
Bought by
Kien Kenny and Ly Tracy T
Home Financials for this Owner
Home Financials are based on the most recent Mortgage that was taken out on this home.
Original Mortgage
$176,800
Interest Rate
7.2%
Create a Home Valuation Report for This Property
The Home Valuation Report is an in-depth analysis detailing your home's value as well as a comparison with similar homes in the area
Home Values in the Area
Average Home Value in this Area
Purchase History
| Date | Buyer | Sale Price | Title Company |
|---|---|---|---|
| Wang Kenny Kien | -- | None Available | |
| Wang Kenny Kien | -- | Stewart Title Of Ca Inc | |
| Kien Kenny | $221,000 | Orange Coast Title |
Source: Public Records
Mortgage History
| Date | Status | Borrower | Loan Amount |
|---|---|---|---|
| Closed | Wang Kenny Kien | $163,000 | |
| Closed | Kien Kenny | $176,800 | |
| Closed | Kien Kenny | $22,100 |
Source: Public Records
Tax History Compared to Growth
Tax History
| Year | Tax Paid | Tax Assessment Tax Assessment Total Assessment is a certain percentage of the fair market value that is determined by local assessors to be the total taxable value of land and additions on the property. | Land | Improvement |
|---|---|---|---|---|
| 2025 | $5,461 | $401,834 | $152,145 | $249,689 |
| 2024 | $5,461 | $393,956 | $149,162 | $244,794 |
| 2023 | $5,310 | $386,233 | $146,238 | $239,995 |
| 2022 | $5,177 | $378,661 | $143,371 | $235,290 |
| 2021 | $5,059 | $371,237 | $140,560 | $230,677 |
| 2019 | $5,157 | $360,228 | $136,392 | $223,836 |
| 2018 | $4,764 | $353,166 | $133,718 | $219,448 |
| 2016 | $4,471 | $339,455 | $128,527 | $210,928 |
| 2015 | $4,433 | $334,357 | $126,597 | $207,760 |
| 2014 | $4,424 | $327,809 | $124,118 | $203,691 |
Source: Public Records
Map
Nearby Homes
- 760 Featherwood Dr
- 32 Franciscan Place
- 25 Franciscan Place
- 428 Golden Springs Dr Unit E
- 980 Golden Springs Dr Unit A
- 547 Bellows Ct
- 454 Ballena Dr
- 1010 Golden Springs Dr Unit B
- 15 Ravencrest Cir
- 1030 Golden Springs Dr Unit B
- 24161 High Knob Rd Unit C
- 24471 Rockbury Dr
- 18 Calle Del Rodeo
- 536 N Del Sol Ln
- 901 Golden Springs Dr Unit D13
- 23966 Decorah Rd
- 330 Ballena Dr
- 1109 Golden Springs Dr Unit G
- 948 N Del Sol Ln
- 1 Country Wood Dr
- 691 Featherwood Dr
- 679 Featherwood Dr
- 675 Featherwood Dr
- 705 Featherwood Dr
- 688 Featherwood Dr
- 678 Featherwood Dr
- 669 Featherwood Dr
- 704 Featherwood Dr
- 711 Featherwood Dr
- 670 Featherwood Dr
- 712 Featherwood Dr
- 663 Featherwood Dr
- 715 Featherwood Dr
- 660 Featherwood Dr
- 728 Featherwood Dr
- 720 Featherwood Dr
- 657 Featherwood Dr
- 719 Featherwood Dr
- 24406 Rosegate Place
- 652 Featherwood Dr