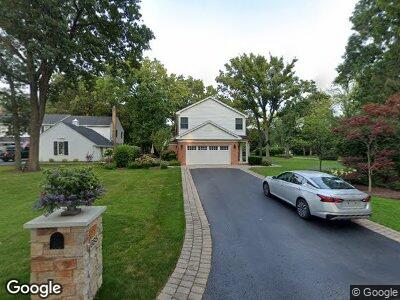
685 Timber Ln Unit 4 Lake Forest, IL 60045
Estimated Value: $1,124,320 - $1,497,000
4
Beds
4
Baths
3,695
Sq Ft
$338/Sq Ft
Est. Value
About This Home
This home is located at 685 Timber Ln Unit 4, Lake Forest, IL 60045 and is currently estimated at $1,250,330, approximately $338 per square foot. 685 Timber Ln Unit 4 is a home located in Lake County with nearby schools including Cherokee Elementary School, Deer Path Middle School East, and Lake Forest High School.
Ownership History
Date
Name
Owned For
Owner Type
Purchase Details
Closed on
Feb 14, 2020
Sold by
Power John G and Powers Robin L
Bought by
Power John G and Powers Robin L
Current Estimated Value
Home Financials for this Owner
Home Financials are based on the most recent Mortgage that was taken out on this home.
Original Mortgage
$300,000
Outstanding Balance
$267,486
Interest Rate
3.4%
Mortgage Type
Credit Line Revolving
Estimated Equity
$982,844
Purchase Details
Closed on
Sep 23, 2013
Sold by
Powers John G and Powers Robin L
Bought by
Powers John G and Powers Robin L
Purchase Details
Closed on
Jun 13, 2007
Sold by
Powers John G
Bought by
Powers John G and Powers Robin L
Home Financials for this Owner
Home Financials are based on the most recent Mortgage that was taken out on this home.
Original Mortgage
$433,000
Interest Rate
5.75%
Mortgage Type
Stand Alone Refi Refinance Of Original Loan
Purchase Details
Closed on
Dec 7, 2000
Sold by
Powers John G and Powers Robin L
Bought by
Powers John G
Create a Home Valuation Report for This Property
The Home Valuation Report is an in-depth analysis detailing your home's value as well as a comparison with similar homes in the area
Home Values in the Area
Average Home Value in this Area
Purchase History
| Date | Buyer | Sale Price | Title Company |
|---|---|---|---|
| Power John G | -- | None Available | |
| Powers John G | -- | None Available | |
| Powers John G | -- | Chicago Title Insurance Co | |
| Powers John G | -- | -- |
Source: Public Records
Mortgage History
| Date | Status | Borrower | Loan Amount |
|---|---|---|---|
| Open | Powers John G | $300,000 | |
| Closed | Powers John G | $413,000 | |
| Closed | Powers John G | $417,000 | |
| Closed | Powers John G | $433,000 | |
| Closed | Powers John G | $433,000 | |
| Closed | Powers John G | $437,000 | |
| Closed | Powers John G | $434,400 | |
| Closed | Powers John G | $50,000 | |
| Closed | Powers John G | $439,400 | |
| Closed | Powers John G | $432,000 |
Source: Public Records
Tax History Compared to Growth
Tax History
| Year | Tax Paid | Tax Assessment Tax Assessment Total Assessment is a certain percentage of the fair market value that is determined by local assessors to be the total taxable value of land and additions on the property. | Land | Improvement |
|---|---|---|---|---|
| 2024 | $17,637 | $338,465 | $105,819 | $232,646 |
| 2023 | $17,637 | $290,020 | $90,673 | $199,347 |
| 2022 | $16,771 | $285,479 | $95,475 | $190,004 |
| 2021 | $15,851 | $275,240 | $92,051 | $183,189 |
| 2020 | $15,440 | $275,820 | $92,245 | $183,575 |
| 2019 | $14,521 | $275,351 | $92,088 | $183,263 |
| 2018 | $8,326 | $299,295 | $97,606 | $201,689 |
| 2017 | $14,785 | $298,341 | $97,295 | $201,046 |
| 2016 | $14,329 | $287,060 | $93,616 | $193,444 |
| 2015 | $14,131 | $263,362 | $87,960 | $175,402 |
| 2014 | $14,303 | $269,662 | $88,589 | $181,073 |
| 2012 | $13,538 | $267,284 | $87,808 | $179,476 |
Source: Public Records
Map
Nearby Homes
- 725 Timber Ln
- 524 Forest Hill Rd
- 887 Timber Ln
- 598 Rockefeller Rd
- 360 Linden Ave
- 340 Hickory Ct
- 360 Hickory Ct
- 715 Linden Ave
- 475 Red Fox Ln
- 995 Waveland Rd
- 200 Glenwood Rd
- 805 Longwood Dr
- 471 Butler Dr Unit 2
- 1171 Beverly Place
- 631 Northmoor Rd
- 825 Highview Terrace
- 262 E Foster Place
- 845 Highview Terrace
- 710 Buena Rd
- 971 Ashley Rd
- 685 Timber Ln Unit 4
- 671 Timber Ln
- 711 Timber Ln
- 655 Timber Ln
- 594 Glenwood Rd
- 575 Glenwood Rd
- 686 Timber Ln
- 674 Timber Ln
- 641 Timber Ln
- 652 Timber Ln
- 602 Glenwood Rd
- 726 Timber Ln
- 611 Glenwood Rd
- 737 Timber Ln
- 619 Timber Ln
- 644 Timber Ln
- 732 Timber Ln
- 623 Glenwood Rd
- 636 Beverly Place
- 626 Beverly Place