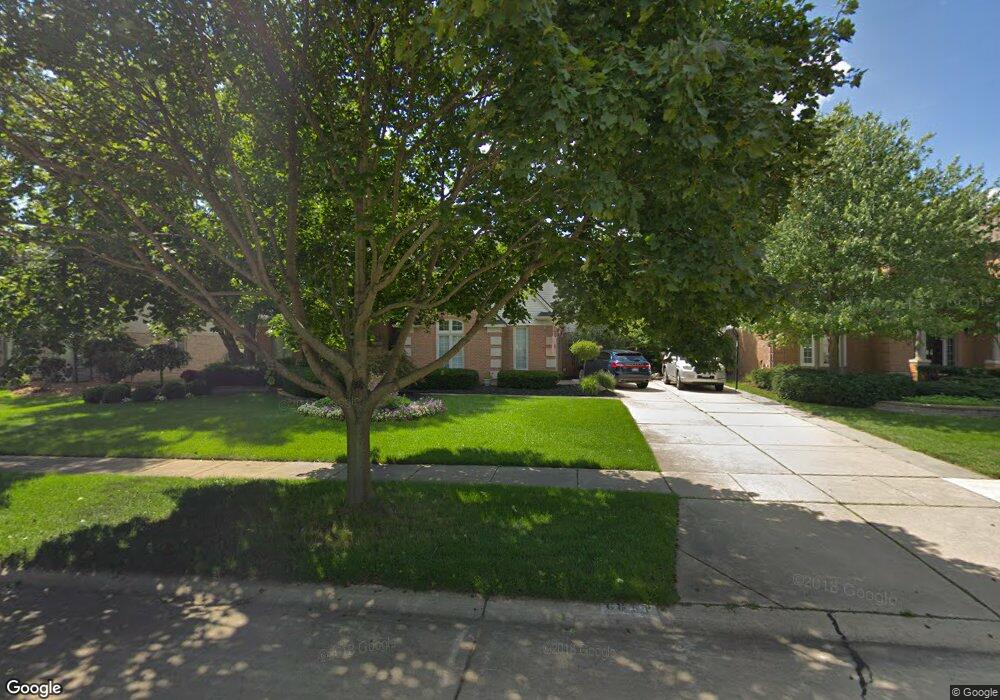
6851 Kings Mill Dr Canton, MI 48187
Estimated Value: $594,205 - $666,000
--
Bed
3
Baths
2,725
Sq Ft
$235/Sq Ft
Est. Value
About This Home
This home is located at 6851 Kings Mill Dr, Canton, MI 48187 and is currently estimated at $641,051, approximately $235 per square foot. 6851 Kings Mill Dr is a home located in Wayne County with nearby schools including Canton High School, Plymouth High School, and Salem High School.
Ownership History
Date
Name
Owned For
Owner Type
Purchase Details
Closed on
Oct 9, 2019
Sold by
Mclellan Moore Kathryn M
Bought by
Moore Kathryn M Mclellan
Current Estimated Value
Purchase Details
Closed on
Jun 17, 2019
Sold by
Fliss Michele M
Bought by
Mclellan Moore Kathryn M
Purchase Details
Closed on
Oct 29, 2013
Sold by
Fliss Michele M
Bought by
Fliss Michele M and Fliss Theresa M
Purchase Details
Closed on
Apr 20, 2007
Sold by
Longuski Keith A and Longuski Linda E
Bought by
Fliss Michele M
Purchase Details
Closed on
May 4, 1998
Sold by
Ryme Jeffrey and Ryme Jeffrey H
Bought by
Longuski Keith A
Purchase Details
Closed on
Mar 20, 1995
Sold by
Lsb Homes Inc
Bought by
Rymer Jeffrey H
Home Financials for this Owner
Home Financials are based on the most recent Mortgage that was taken out on this home.
Original Mortgage
$257,400
Interest Rate
8.82%
Mortgage Type
New Conventional
Create a Home Valuation Report for This Property
The Home Valuation Report is an in-depth analysis detailing your home's value as well as a comparison with similar homes in the area
Home Values in the Area
Average Home Value in this Area
Purchase History
| Date | Buyer | Sale Price | Title Company |
|---|---|---|---|
| Moore Kathryn M Mclellan | -- | None Available | |
| Mclellan Moore Kathryn M | $475,000 | Stg | |
| Fliss Michele M | -- | None Available | |
| Fliss Michele M | $415,000 | Transnation Title Ins Co | |
| Longuski Keith A | $310,000 | -- | |
| Rymer Jeffrey H | $287,000 | -- |
Source: Public Records
Mortgage History
| Date | Status | Borrower | Loan Amount |
|---|---|---|---|
| Previous Owner | Rymer Jeffrey H | $257,400 |
Source: Public Records
Tax History Compared to Growth
Tax History
| Year | Tax Paid | Tax Assessment Tax Assessment Total Assessment is a certain percentage of the fair market value that is determined by local assessors to be the total taxable value of land and additions on the property. | Land | Improvement |
|---|---|---|---|---|
| 2025 | $4,193 | $272,100 | $0 | $0 |
| 2024 | $4,193 | $260,900 | $0 | $0 |
| 2023 | $3,997 | $241,800 | $0 | $0 |
| 2022 | $8,603 | $220,800 | $0 | $0 |
| 2021 | $8,350 | $210,600 | $0 | $0 |
| 2020 | $8,249 | $201,300 | $0 | $0 |
| 2019 | $7,823 | $193,890 | $0 | $0 |
| 2018 | $3,281 | $188,520 | $0 | $0 |
| 2017 | $7,853 | $188,100 | $0 | $0 |
| 2016 | $7,102 | $194,900 | $0 | $0 |
| 2015 | $18,025 | $191,740 | $0 | $0 |
| 2013 | $16,648 | $184,950 | $0 | $0 |
| 2010 | -- | $147,600 | $69,414 | $78,186 |
Source: Public Records
Map
Nearby Homes
- 6680 Kings Mill Dr
- 7040 Royal Villa Ct Unit 6
- 48107 Hanford Rd
- 49068 Poppleton Ct
- 48406 Warren Rd
- 49093 Poppleton Ct
- 5922 Valley View Dr
- 5885 Fairborn Dr
- 46500 E Oak Manor Ct
- 47582 Fox Ct
- 7225 Camelia Ct
- 48315 Ford Rd
- 48375 Ford Rd
- 0 N Beck Rd
- 8140 N Pointe Ct
- 2032 Tradition Dr
- 6844 Woodmere Dr
- 7319 Haverhill Ct S
- 7809 Haverhill Ct N
- 1630 Mistwood Ct
- 6837 Kings Mill Dr
- 6865 Kings Mill Dr
- 6879 Kings Mill Dr
- 6852 Kings Mill Dr
- 6866 Kings Mill Dr
- 6838 Kings Mill Dr
- 6823 Kings Mill Dr
- 6880 Kings Mill Dr
- 6893 Kings Mill Dr
- 6824 Kings Mill Dr
- 6894 Kings Mill Dr
- 6809 Kings Mill Dr
- 6907 Kings Mill Dr
- 6810 Kings Mill Dr
- 6908 Kings Mill Dr
- 6795 Kings Mill Dr
- 6796 Kings Mill Dr
- 48176 Picadilly Ct
- 48177 Park Lane Ct
- 6931 Kings Mill Dr