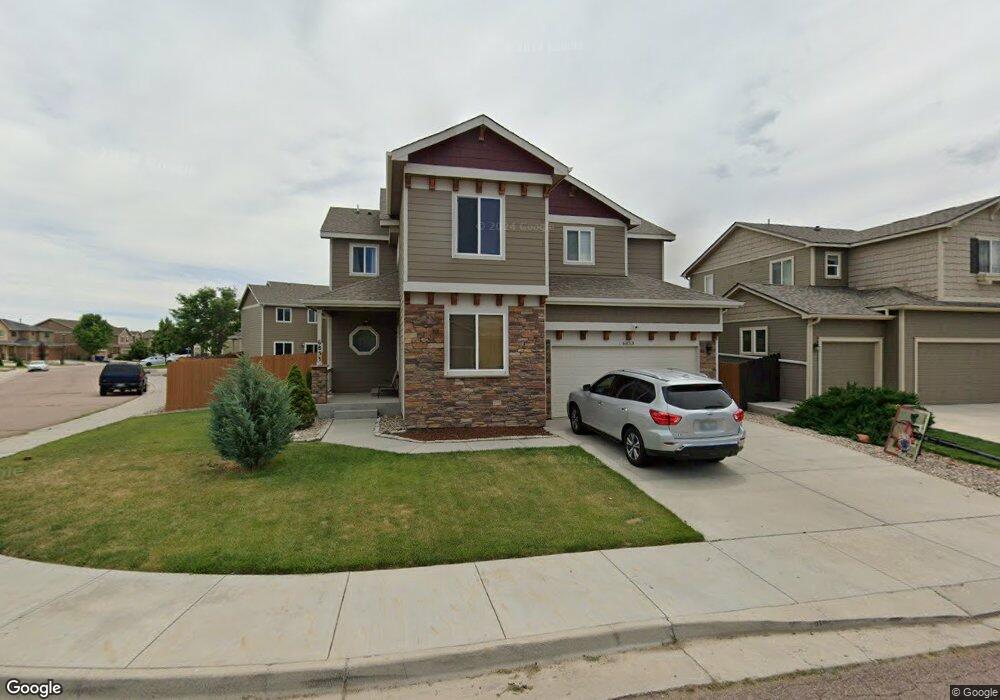
6853 Alliance Loop Colorado Springs, CO 80925
Widefield NeighborhoodEstimated Value: $475,005 - $519,000
4
Beds
3
Baths
2,450
Sq Ft
$202/Sq Ft
Est. Value
About This Home
This home is located at 6853 Alliance Loop, Colorado Springs, CO 80925 and is currently estimated at $494,501, approximately $201 per square foot. 6853 Alliance Loop is a home located in El Paso County with nearby schools including Grand Mountain School, Mesa Ridge High School, and Valley Christian Academy.
Ownership History
Date
Name
Owned For
Owner Type
Purchase Details
Closed on
Jul 27, 2020
Sold by
Edon Jonathan L
Bought by
Carreno Jonathan and Carreno Merly
Current Estimated Value
Home Financials for this Owner
Home Financials are based on the most recent Mortgage that was taken out on this home.
Original Mortgage
$408,184
Outstanding Balance
$363,418
Interest Rate
3.2%
Mortgage Type
VA
Estimated Equity
$131,083
Purchase Details
Closed on
Mar 21, 2018
Sold by
Davis Adam and Davis Nancy
Bought by
Edon Jonathan L
Home Financials for this Owner
Home Financials are based on the most recent Mortgage that was taken out on this home.
Original Mortgage
$322,389
Interest Rate
4.32%
Mortgage Type
VA
Purchase Details
Closed on
Mar 28, 2013
Sold by
Saint Aubuyn Homes Llc
Bought by
Davis Adam and Davis Nancy
Home Financials for this Owner
Home Financials are based on the most recent Mortgage that was taken out on this home.
Original Mortgage
$266,963
Interest Rate
3.62%
Mortgage Type
VA
Purchase Details
Closed on
Oct 11, 2012
Sold by
Lorson Llc
Bought by
Saint Aubyn Homes Llc
Create a Home Valuation Report for This Property
The Home Valuation Report is an in-depth analysis detailing your home's value as well as a comparison with similar homes in the area
Home Values in the Area
Average Home Value in this Area
Purchase History
| Date | Buyer | Sale Price | Title Company |
|---|---|---|---|
| Carreno Jonathan | $394,000 | Heritage Title Company | |
| Edon Jonathan L | $312,000 | Unified Title Co | |
| Davis Adam | $264,000 | Heritage Title | |
| Saint Aubyn Homes Llc | $231,000 | Heritage Title |
Source: Public Records
Mortgage History
| Date | Status | Borrower | Loan Amount |
|---|---|---|---|
| Open | Carreno Jonathan | $408,184 | |
| Previous Owner | Edon Jonathan L | $322,389 | |
| Previous Owner | Davis Adam | $266,963 |
Source: Public Records
Tax History Compared to Growth
Tax History
| Year | Tax Paid | Tax Assessment Tax Assessment Total Assessment is a certain percentage of the fair market value that is determined by local assessors to be the total taxable value of land and additions on the property. | Land | Improvement |
|---|---|---|---|---|
| 2025 | $4,631 | $33,330 | -- | -- |
| 2024 | $4,589 | $34,470 | $6,040 | $28,430 |
| 2022 | $3,432 | $24,790 | $4,810 | $19,980 |
| 2021 | $3,574 | $25,510 | $4,950 | $20,560 |
| 2020 | $3,451 | $24,370 | $4,330 | $20,040 |
| 2019 | $3,439 | $24,370 | $4,330 | $20,040 |
| 2018 | $2,979 | $20,780 | $4,360 | $16,420 |
| 2017 | $3,041 | $20,780 | $4,360 | $16,420 |
| 2016 | $2,638 | $20,380 | $4,380 | $16,000 |
| 2015 | $2,779 | $20,380 | $4,380 | $16,000 |
| 2014 | $2,766 | $20,380 | $4,290 | $16,090 |
Source: Public Records
Map
Nearby Homes
- 6572 Justice Way
- 10202 Abrams Dr
- 10208 Abrams Dr
- 10179 Seawolf Dr
- 10405 Abrams Dr
- 10394 Abrams Dr
- 10250 Intrepid Way
- 10732 Deer Meadow Cir
- 10868 Deer Meadow Cir
- 10670 Abrams Dr
- 10634 Abrams Dr
- 10442 Abrams Dr
- 10604 Deer Meadow Cir
- 10568 Kalama Dr
- 6868 Alsea Dr
- 10525 Abrams Dr
- 6225 Laurel Grass Range Trail
- 6562 Phantom Way
- 6961 Maidford Dr
- 6672 Kearsarge Dr
- 6861 Alliance Loop
- 6869 Alliance Loop
- 10392 Valor Ct
- 10378 Valor Ct
- 6822 Alliance Loop
- 6854 Alliance Loop
- 6846 Alliance Loop
- 6830 Alliance Loop
- 6862 Alliance Loop
- 10362 Valor Ct
- 6877 Alliance Loop
- 6814 Alliance Loop
- 6838 Alliance Loop
- 6870 Alliance Loop
- 6806 Alliance Loop
- 6885 Alliance Loop
- 6797 Alliance Loop
- 6552 Justice Way
- 10346 Valor Ct
- 6798 Alliance Loop