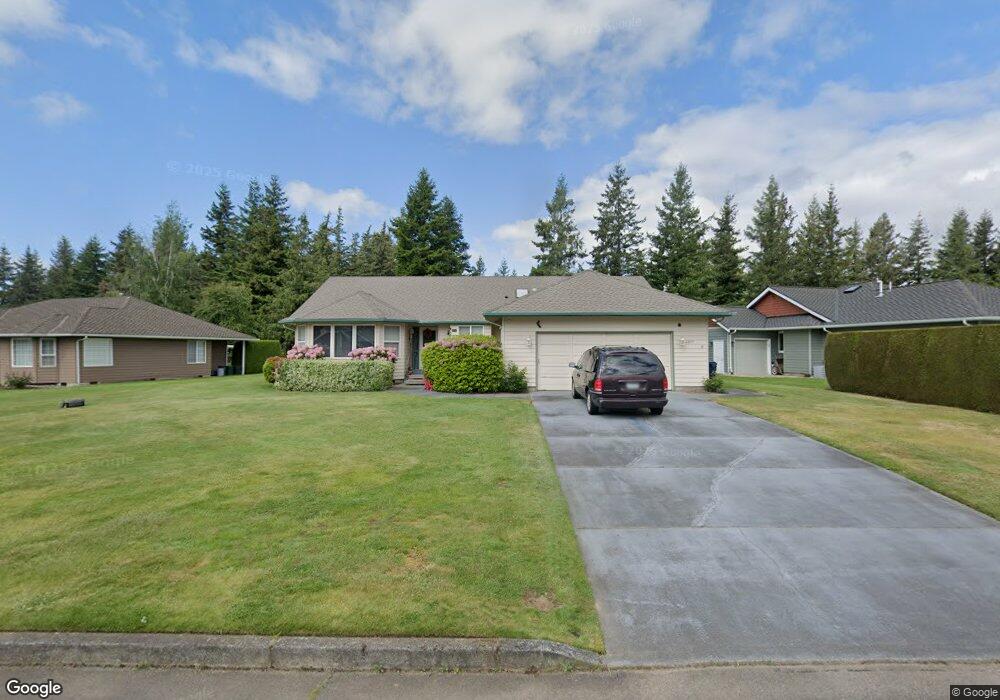
6855 Raspberry Dr Everson, WA 98247
Estimated Value: $567,000 - $758,000
3
Beds
2
Baths
1,804
Sq Ft
$347/Sq Ft
Est. Value
About This Home
This home is located at 6855 Raspberry Dr, Everson, WA 98247 and is currently estimated at $625,885, approximately $346 per square foot. 6855 Raspberry Dr is a home located in Whatcom County with nearby schools including Irene Reither Elementary School, Meridian Middle School, and Meridian High School.
Ownership History
Date
Name
Owned For
Owner Type
Purchase Details
Closed on
Sep 16, 2025
Sold by
Fuhs Douglas A
Bought by
Harris Mary B Fuhs
Current Estimated Value
Purchase Details
Closed on
Jun 14, 2023
Sold by
Fuhs Harris Mary B
Bought by
Fuhs Douglas A
Purchase Details
Closed on
May 12, 2023
Sold by
Fuhs Douglas A
Bought by
Fuhs Douglas A and Harris Mary B
Purchase Details
Closed on
May 18, 2021
Sold by
Fuhs Douglas A
Bought by
Fuhs Douglas A and Harris Mary Barbara
Purchase Details
Closed on
Feb 7, 2018
Sold by
Fuhs Douglas A and Fuhs Grace M
Bought by
Fuhs Douglas A
Create a Home Valuation Report for This Property
The Home Valuation Report is an in-depth analysis detailing your home's value as well as a comparison with similar homes in the area
Purchase History
| Date | Buyer | Sale Price | Title Company |
|---|---|---|---|
| Harris Mary B Fuhs | $313 | None Listed On Document | |
| Fuhs Douglas A | -- | None Listed On Document | |
| Fuhs Douglas A | $313 | None Listed On Document | |
| Fuhs Douglas A | -- | None Listed On Document | |
| Fuhs Douglas A | -- | None Listed On Document | |
| Fuhs Douglas A | -- | First American Title Ops |
Source: Public Records
Tax History
| Year | Tax Paid | Tax Assessment Tax Assessment Total Assessment is a certain percentage of the fair market value that is determined by local assessors to be the total taxable value of land and additions on the property. | Land | Improvement |
|---|---|---|---|---|
| 2025 | $482 | $592,474 | $257,050 | $335,424 |
| 2024 | $449 | $577,924 | $242,500 | $335,424 |
| 2023 | $449 | $572,523 | $250,000 | $322,523 |
| 2022 | $1,055 | $520,443 | $194,849 | $157,369 |
| 2021 | $1,160 | $430,107 | $161,028 | $157,369 |
| 2020 | $1,206 | $384,029 | $143,777 | $240,252 |
| 2019 | $1,269 | $352,645 | $132,027 | $220,618 |
| 2018 | $1,365 | $327,040 | $122,441 | $204,599 |
| 2017 | $1,414 | $280,456 | $105,000 | $175,456 |
| 2016 | $1,401 | $265,118 | $100,620 | $164,498 |
| 2015 | $1,942 | $254,608 | $96,720 | $157,888 |
| 2014 | -- | $248,444 | $94,380 | $154,064 |
| 2013 | -- | $241,151 | $91,650 | $149,501 |
Source: Public Records
Map
Nearby Homes
- 6849 Raspberry Dr
- 6917 Red Ridge Dr
- 6778 La Monte Dr
- 6786 La Bello Dr
- 6743 La Bello Dr
- 7343 Hannegan Rd Unit 2
- 7393 Hannegan Rd
- 380 E Pole Rd Unit 13
- 1375 Ten Mile Rd
- 1383 Ten Mile Rd
- 765 van Dyk Rd
- 1822 E Pole Rd
- 6049 Medcalf Rd
- 1817 Central Rd
- 0 Old Guide Rd
- 5774 Denali Ln
- 5747 Denali Ln
- 5750 Denali Ln
- 5707 Denali Ln
- 740 Denali Ct
- 6861 Raspberry Dr
- 0 L30 Golf View Dr
- 6867 Raspberry Dr
- 6843 Raspberry Dr
- 6852 Raspberry Dr Unit B
- 6852 Raspberry Dr Unit A
- 6873 Raspberry Dr
- 6837 Raspberry Dr
- 6850 Raspberry Dr Unit B
- 6850 Raspberry Dr Unit A
- 6858 Raspberry Dr
- 6862 Raspberry Dr
- 6848 Raspberry Dr Unit B
- 6866 Raspberry Dr
- 6846A Raspberry Dr
- 6846 Raspberry Dr Unit B
- 6846 Raspberry Dr Unit A
- 6846 Raspberry Dr
- 6879 Raspberry Dr
Your Personal Tour Guide
Ask me questions while you tour the home.