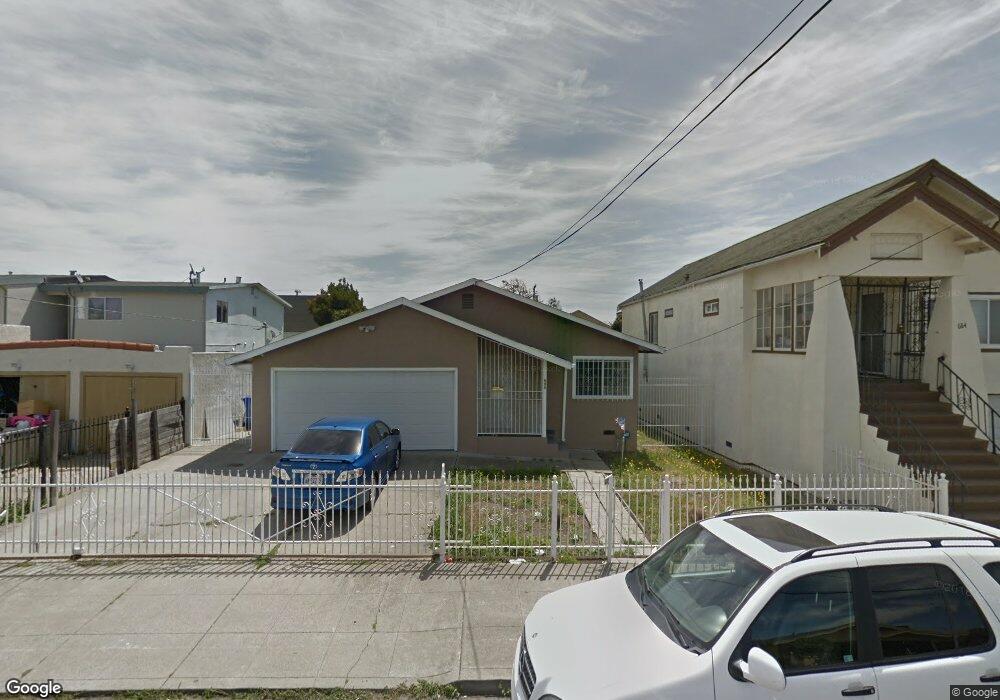
686 8th St Richmond, CA 94801
Iron Triangle NeighborhoodEstimated Value: $445,296 - $525,000
3
Beds
1
Bath
983
Sq Ft
$492/Sq Ft
Est. Value
About This Home
This home is located at 686 8th St, Richmond, CA 94801 and is currently estimated at $483,824, approximately $492 per square foot. 686 8th St is a home located in Contra Costa County with nearby schools including Peres Elementary School, Walter T. Helms Middle School, and Richmond High School.
Ownership History
Date
Name
Owned For
Owner Type
Purchase Details
Closed on
Dec 1, 2011
Sold by
Castillo Osmin D
Bought by
Castillo Karen
Current Estimated Value
Home Financials for this Owner
Home Financials are based on the most recent Mortgage that was taken out on this home.
Original Mortgage
$111,110
Outstanding Balance
$75,635
Interest Rate
4.06%
Mortgage Type
FHA
Estimated Equity
$408,189
Purchase Details
Closed on
Aug 26, 2011
Sold by
Jones Deannette and Jones Deanette
Bought by
Kapu Properties Llc
Purchase Details
Closed on
Mar 15, 1996
Sold by
Jones Anthony Ray
Bought by
Jones Anthony Ray and Jones Deanette
Create a Home Valuation Report for This Property
The Home Valuation Report is an in-depth analysis detailing your home's value as well as a comparison with similar homes in the area
Home Values in the Area
Average Home Value in this Area
Purchase History
| Date | Buyer | Sale Price | Title Company |
|---|---|---|---|
| Castillo Karen | -- | Old Republic Title Company | |
| Castillo Karen | $114,000 | Old Republic Title Company | |
| Kapu Properties Llc | $60,000 | Old Republic Title Company | |
| Jones Anthony Ray | -- | North American Title Co |
Source: Public Records
Mortgage History
| Date | Status | Borrower | Loan Amount |
|---|---|---|---|
| Open | Castillo Karen | $111,110 |
Source: Public Records
Tax History Compared to Growth
Tax History
| Year | Tax Paid | Tax Assessment Tax Assessment Total Assessment is a certain percentage of the fair market value that is determined by local assessors to be the total taxable value of land and additions on the property. | Land | Improvement |
|---|---|---|---|---|
| 2025 | $3,426 | $143,177 | $35,665 | $107,512 |
| 2024 | $3,341 | $140,370 | $34,966 | $105,404 |
| 2023 | $3,341 | $137,619 | $34,281 | $103,338 |
| 2022 | $3,246 | $134,921 | $33,609 | $101,312 |
| 2021 | $3,173 | $132,276 | $32,950 | $99,326 |
| 2019 | $2,966 | $128,355 | $31,974 | $96,381 |
| 2018 | $2,852 | $125,840 | $31,348 | $94,492 |
| 2017 | $2,767 | $123,374 | $30,734 | $92,640 |
| 2016 | $2,698 | $120,956 | $30,132 | $90,824 |
| 2015 | $2,655 | $119,140 | $29,680 | $89,460 |
| 2014 | $2,635 | $116,807 | $29,099 | $87,708 |
Source: Public Records
Map
Nearby Homes