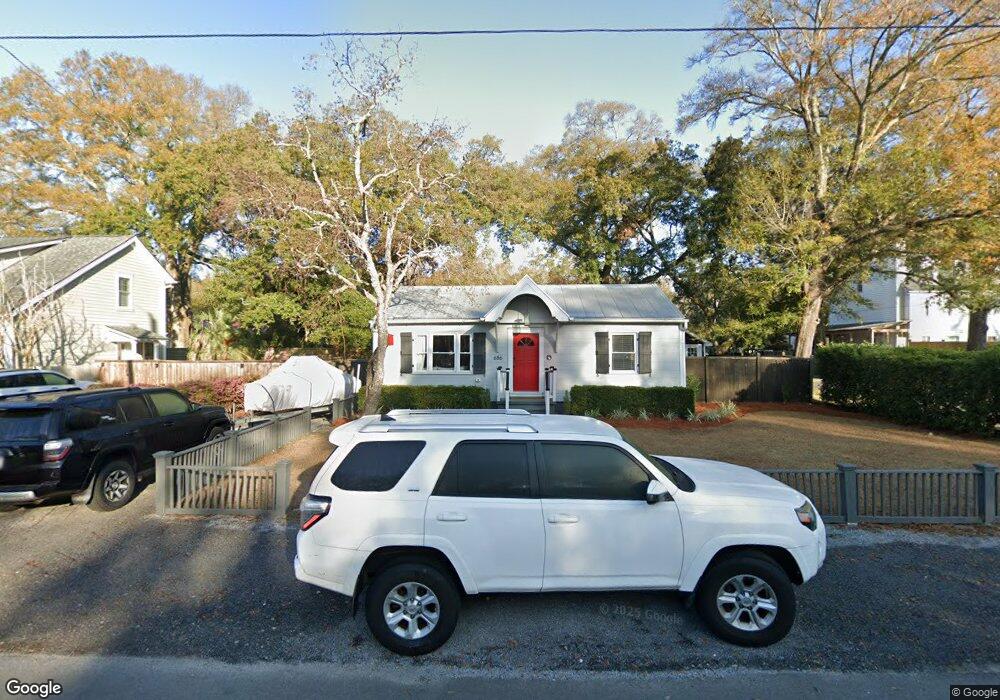
686 Adluh St Mount Pleasant, SC 29464
Old Village NeighborhoodEstimated Value: $1,097,000 - $1,120,000
2
Beds
1
Bath
825
Sq Ft
$1,342/Sq Ft
Est. Value
About This Home
This home is located at 686 Adluh St, Mount Pleasant, SC 29464 and is currently estimated at $1,107,005, approximately $1,341 per square foot. 686 Adluh St is a home located in Charleston County with nearby schools including Mt. Pleasant Academy, Moultrie Middle School, and Lucy Garrett Beckham High School.
Ownership History
Date
Name
Owned For
Owner Type
Purchase Details
Closed on
Aug 5, 2025
Sold by
Kraeling Brett B and Kraeling Jarrett Z
Bought by
686 Adluh Llc
Current Estimated Value
Purchase Details
Closed on
Nov 25, 2024
Sold by
Livingston Cynthia Ann
Bought by
Kraeling Brett B and Kraeling Jarrett Z
Purchase Details
Closed on
May 16, 2019
Sold by
Burnett Alexander D
Bought by
Livingston Cynthia Ann
Purchase Details
Closed on
Jun 5, 2014
Sold by
Samford Craig S and Black Amy M
Bought by
Burnett Alexander D
Home Financials for this Owner
Home Financials are based on the most recent Mortgage that was taken out on this home.
Original Mortgage
$296,000
Interest Rate
4.4%
Mortgage Type
New Conventional
Purchase Details
Closed on
Jun 1, 2007
Sold by
Lynn Richard A
Bought by
Black Amy M and Samford Craig S
Purchase Details
Closed on
Jul 2, 2004
Sold by
Ralls Cari and Madison John David
Bought by
Lynn Richard A
Purchase Details
Closed on
Jun 29, 2000
Sold by
Washburn Martin Lynn
Bought by
Ralls Cari and Madison John David
Create a Home Valuation Report for This Property
The Home Valuation Report is an in-depth analysis detailing your home's value as well as a comparison with similar homes in the area
Home Values in the Area
Average Home Value in this Area
Purchase History
| Date | Buyer | Sale Price | Title Company |
|---|---|---|---|
| 686 Adluh Llc | -- | None Listed On Document | |
| 686 Adluh Llc | -- | None Listed On Document | |
| Kraeling Brett B | $1,050,000 | None Listed On Document | |
| Kraeling Brett B | $1,050,000 | None Listed On Document | |
| Livingston Cynthia Ann | $475,000 | None Available | |
| Burnett Alexander D | $312,500 | -- | |
| Black Amy M | $295,000 | None Available | |
| Lynn Richard A | $204,000 | -- | |
| Ralls Cari | $143,000 | -- |
Source: Public Records
Mortgage History
| Date | Status | Borrower | Loan Amount |
|---|---|---|---|
| Previous Owner | Burnett Alexander D | $296,000 |
Source: Public Records
Tax History Compared to Growth
Tax History
| Year | Tax Paid | Tax Assessment Tax Assessment Total Assessment is a certain percentage of the fair market value that is determined by local assessors to be the total taxable value of land and additions on the property. | Land | Improvement |
|---|---|---|---|---|
| 2024 | $3,914 | $19,000 | $0 | $0 |
| 2023 | $1,905 | $19,000 | $0 | $0 |
| 2022 | $1,749 | $19,000 | $0 | $0 |
| 2021 | $1,924 | $19,000 | $0 | $0 |
| 2020 | $2,005 | $19,000 | $0 | $0 |
| 2019 | $1,363 | $12,500 | $0 | $0 |
| 2017 | $1,344 | $12,500 | $0 | $0 |
| 2016 | $1,281 | $12,500 | $0 | $0 |
| 2015 | $1,338 | $12,500 | $0 | $0 |
| 2014 | $1,111 | $0 | $0 | $0 |
| 2011 | -- | $0 | $0 | $0 |
Source: Public Records
Map
Nearby Homes
- 948 McCants Dr
- 733 Atlantic St
- 651 McCants Dr
- 727 McCants Dr
- 1334 Fairmont Ave
- 734 Powhatan Ave
- 747 Winthrop St
- 758 McCants Dr
- 725 King St
- 670 Poaug Ln
- 1335 Erckmann Dr
- 1463 Seminole St
- 515 Bank St
- 1226 Fairmont Ave Unit 5D
- 605 Ann St
- 1504 Old Village Dr
- 425 King St
- 916 Kincade Dr
- 922 Kincade Dr
- 1409 Barbara St