

$279,900 Open Sun 1PM - 3PM
- 3 Beds
- 2 Baths
- 1,540 Sq Ft
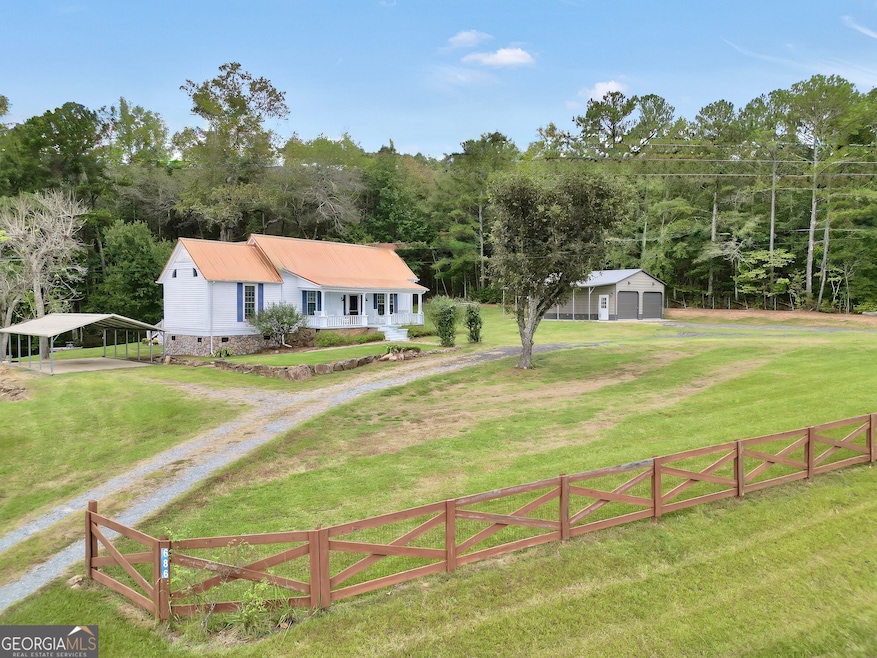
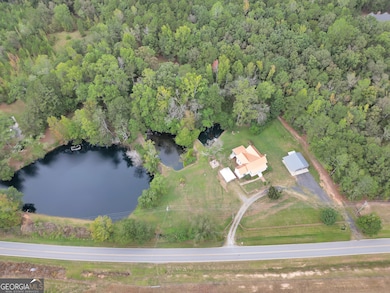
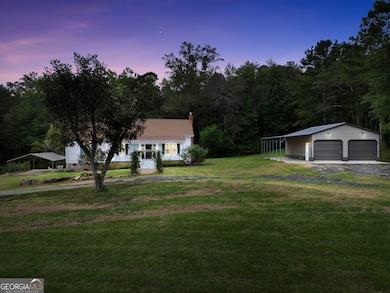
- 1404 Saddlebrook Ct
- Locust Grove, GA
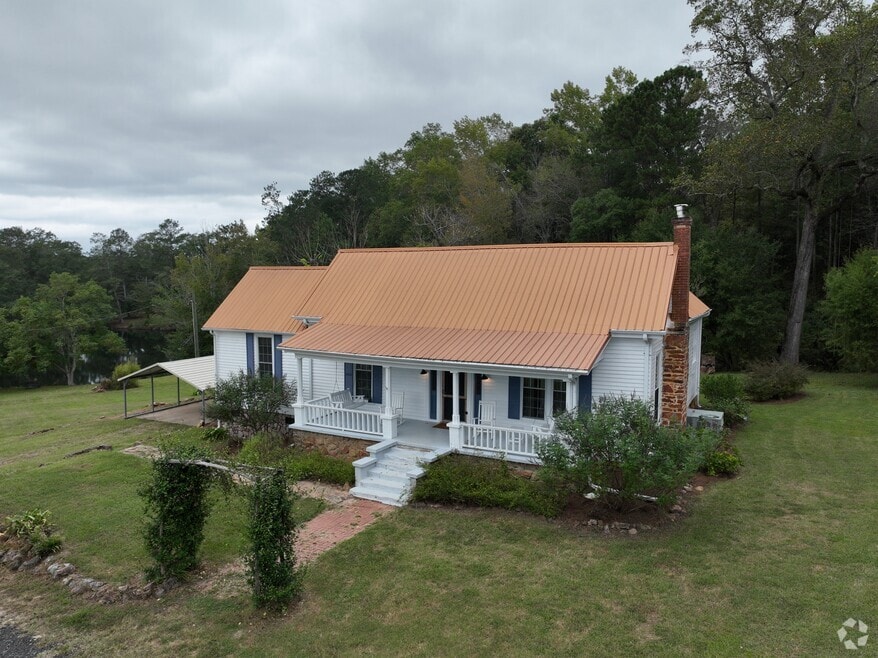
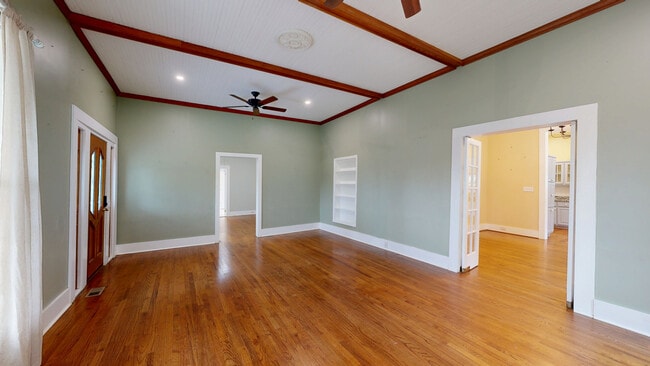
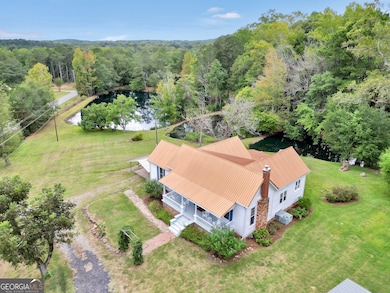
Welcome to your charming Locust Grove ranch retreat! This beautifully maintained 3-bedroom, 2-bathroom home offers comfort, style, and privacy in a peaceful setting. Step inside to discover an inviting floor plan featuring a spacious living room perfect for relaxing or entertaining. The separate dining area provides the ideal space for family meals and gatherings. The kitchen is equipped with
Linda Bell Bell Realty & Co.