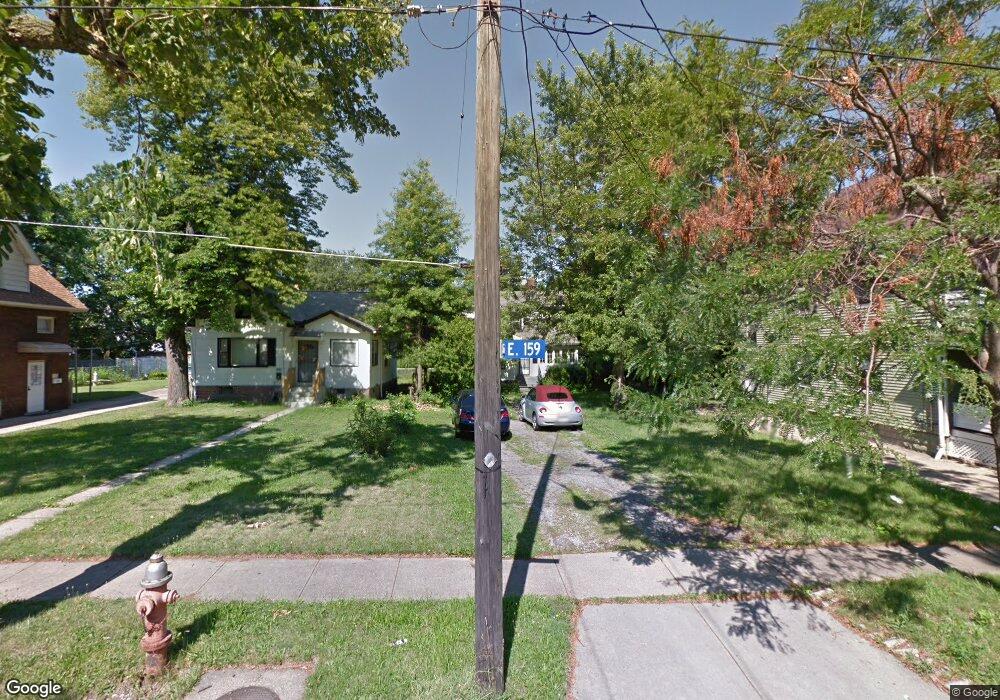
686 E 159th St Cleveland, OH 44110
South Collinwood NeighborhoodEstimated Value: $109,113
3
Beds
2
Baths
1,792
Sq Ft
$61/Sq Ft
Est. Value
About This Home
This home is located at 686 E 159th St, Cleveland, OH 44110 and is currently estimated at $109,113, approximately $60 per square foot. 686 E 159th St is a home located in Cuyahoga County with nearby schools including East Academy and St. Jerome Elementary School.
Ownership History
Date
Name
Owned For
Owner Type
Purchase Details
Closed on
Aug 12, 2024
Sold by
Cuyahoga County Land Reutilization Corpo
Bought by
Evans Crystal J
Current Estimated Value
Purchase Details
Closed on
Aug 19, 1997
Sold by
Transitional Properties
Bought by
Rice Edythe J
Purchase Details
Closed on
Jul 11, 1996
Sold by
Hoffman Thomas A
Bought by
Tucky Steven J
Home Financials for this Owner
Home Financials are based on the most recent Mortgage that was taken out on this home.
Original Mortgage
$24,800
Interest Rate
6.99%
Mortgage Type
New Conventional
Purchase Details
Closed on
Nov 27, 1991
Sold by
Bost Raymond E
Bought by
Hoffman Thomas A
Purchase Details
Closed on
Sep 12, 1977
Sold by
Chartier Arthur N
Bought by
Bost Raymond E
Purchase Details
Closed on
Nov 12, 1976
Sold by
Pietrantozzi Luis J
Bought by
Chartier Arthur N
Purchase Details
Closed on
Jul 22, 1975
Sold by
Pietrantozzi Louis J and H A
Bought by
Rogers Rosemary
Purchase Details
Closed on
Jan 1, 1975
Bought by
Pietrantozzi Louis J and H A
Create a Home Valuation Report for This Property
The Home Valuation Report is an in-depth analysis detailing your home's value as well as a comparison with similar homes in the area
Home Values in the Area
Average Home Value in this Area
Purchase History
| Date | Buyer | Sale Price | Title Company |
|---|---|---|---|
| Evans Crystal J | -- | None Listed On Document | |
| Rice Edythe J | $48,500 | -- | |
| Tucky Steven J | $31,000 | -- | |
| Hoffman Thomas A | $27,000 | -- | |
| Bost Raymond E | $15,300 | -- | |
| Chartier Arthur N | $15,900 | -- | |
| Pietrantozzi Luis J | -- | -- | |
| Rogers Rosemary | -- | -- | |
| Pietrantozzi Louis J | -- | -- |
Source: Public Records
Mortgage History
| Date | Status | Borrower | Loan Amount |
|---|---|---|---|
| Previous Owner | Tucky Steven J | $24,800 |
Source: Public Records
Tax History
| Year | Tax Paid | Tax Assessment Tax Assessment Total Assessment is a certain percentage of the fair market value that is determined by local assessors to be the total taxable value of land and additions on the property. | Land | Improvement |
|---|---|---|---|---|
| 2024 | -- | $17,745 | $3,850 | $13,895 |
| 2023 | $891 | $11,490 | $4,240 | $7,250 |
| 2022 | $1,268 | $11,480 | $4,235 | $7,245 |
| 2021 | $877 | $11,480 | $4,240 | $7,250 |
| 2020 | $890 | $10,080 | $3,710 | $6,370 |
| 2019 | $1,728 | $28,800 | $10,600 | $18,200 |
| 2018 | $822 | $10,080 | $3,710 | $6,370 |
| 2017 | $971 | $11,480 | $5,320 | $6,160 |
| 2016 | $11,095 | $11,480 | $5,320 | $6,160 |
| 2015 | $1,112 | $11,480 | $5,320 | $6,160 |
| 2014 | $1,112 | $13,200 | $6,130 | $7,070 |
Source: Public Records
Map
Nearby Homes
- 653 E 159th St
- 715 E 156th St
- v/l Saint Clair Ave
- 15951 Whitcomb Rd Unit 53
- 771 E 154th St
- 797 Alhambra Rd
- 723 E 165th St
- 792 London Rd
- 805 Rudyard Rd
- 821 E 156th St
- 737 E 165th St
- 813 Wayside Rd
- 833 E 156th St
- 836 E 156th St
- 827 London Rd
- 836 Rudyard Rd
- 831 London Rd
- 16523 Kipling Ave
- 895 Rondel Rd
- 15008 Sylvia Ave
Your Personal Tour Guide
Ask me questions while you tour the home.