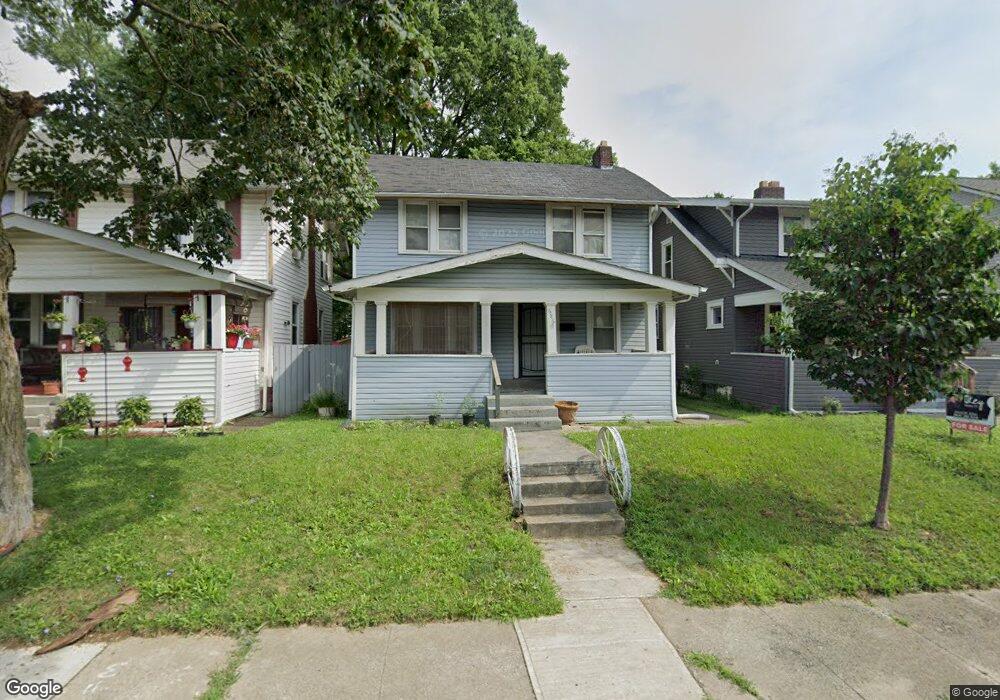
686 E Kossuth St Columbus, OH 43206
Southern Orchards NeighborhoodEstimated Value: $156,000 - $217,000
3
Beds
1
Bath
1,329
Sq Ft
$151/Sq Ft
Est. Value
About This Home
This home is located at 686 E Kossuth St, Columbus, OH 43206 and is currently estimated at $200,514, approximately $150 per square foot. 686 E Kossuth St is a home located in Franklin County with nearby schools including Livingston Elementary School, South High School, and South Columbus Preparatory Academy.
Ownership History
Date
Name
Owned For
Owner Type
Purchase Details
Closed on
Oct 14, 2011
Sold by
Armstrong Thomas and 686 Kossuth Land Trust
Bought by
Rts Enterprises Llc
Current Estimated Value
Home Financials for this Owner
Home Financials are based on the most recent Mortgage that was taken out on this home.
Original Mortgage
$30,000
Interest Rate
4.12%
Mortgage Type
Future Advance Clause Open End Mortgage
Purchase Details
Closed on
May 16, 2011
Sold by
Fupa Investments Llc
Bought by
Armstrong Thomas and Teh 686 Kossuth Land Trust
Purchase Details
Closed on
Jul 26, 2007
Sold by
Lasalle Bank Na
Bought by
Fupa Investments Llc
Purchase Details
Closed on
Dec 26, 2006
Sold by
Johnson Stephen P and Johnson Stephen Porter
Bought by
Lasalle Bank Na and Afc Trust Series 1999-4
Purchase Details
Closed on
Jul 2, 1990
Bought by
Johnson Stephen P
Purchase Details
Closed on
Jun 1, 1977
Create a Home Valuation Report for This Property
The Home Valuation Report is an in-depth analysis detailing your home's value as well as a comparison with similar homes in the area
Home Values in the Area
Average Home Value in this Area
Purchase History
| Date | Buyer | Sale Price | Title Company |
|---|---|---|---|
| Rts Enterprises Llc | $50,000 | Attorney | |
| Armstrong Thomas | -- | Attorney | |
| Fupa Investments Llc | $26,000 | Fidelity Land Title Agency | |
| Lasalle Bank Na | $40,000 | None Available | |
| Johnson Stephen P | $42,000 | -- | |
| -- | $23,000 | -- |
Source: Public Records
Mortgage History
| Date | Status | Borrower | Loan Amount |
|---|---|---|---|
| Closed | Rts Enterprises Llc | $30,000 |
Source: Public Records
Tax History
| Year | Tax Paid | Tax Assessment Tax Assessment Total Assessment is a certain percentage of the fair market value that is determined by local assessors to be the total taxable value of land and additions on the property. | Land | Improvement |
|---|---|---|---|---|
| 2025 | $2,881 | $61,400 | $27,830 | $33,570 |
| 2024 | $2,881 | $61,400 | $27,830 | $33,570 |
| 2023 | $2,812 | $61,390 | $27,825 | $33,565 |
| 2022 | $1,358 | $25,560 | $5,220 | $20,340 |
| 2021 | $1,361 | $25,560 | $5,220 | $20,340 |
| 2020 | $1,363 | $25,560 | $5,220 | $20,340 |
| 2019 | $1,169 | $18,800 | $3,990 | $14,810 |
| 2018 | $584 | $18,800 | $3,990 | $14,810 |
| 2017 | $1,169 | $18,800 | $3,990 | $14,810 |
| 2016 | $1,130 | $16,630 | $3,150 | $13,480 |
| 2015 | $514 | $16,630 | $3,150 | $13,480 |
| 2014 | $1,031 | $16,630 | $3,150 | $13,480 |
| 2013 | $535 | $17,500 | $3,325 | $14,175 |
Source: Public Records
Map
Nearby Homes
- 630 Stanley Ave
- 827 S 17th St
- 615 E Columbus St
- 841 Ann St
- 640 E Whittier St
- 779-781 Stanley Ave
- 863 Carpenter St
- 960 Carpenter St
- 735 Reinhard Ave
- 751 Wager St
- 497 E Kossuth St
- 741 Heyl Ave
- 517 Forest St
- 800 Carpenter St
- 870 Gilbert St
- 932 Wagner St
- 472 E Whittier St
- 999 S 22nd St
- 676 Wager St
- 867 S 22nd St
- 682 E Kossuth St
- 694 E Kossuth St
- 676 E Kossuth St
- 698 E Kossuth St
- 704 E Kossuth St
- 668 E Kossuth St
- 693 E Columbus St
- 687 E Columbus St Unit 689
- 687 E Columbus St Unit 687 E Columbus St
- 683 E Columbus St
- 701 E Columbus St
- 708 E Kossuth St
- 699 E Kossuth St
- 701 E Kossuth St
- 683 E Kossuth St
- 705 E Columbus St
- 687 E Kossuth St
- 679 E Kossuth St
- 697 E Kossuth St Unit 3
- 675 E Kossuth St
Your Personal Tour Guide
Ask me questions while you tour the home.