6864 Maple Leaf Dr Carlsbad, CA 92011
Poinsettia NeighborhoodEstimated Value: $955,000 - $1,204,000
3
Beds
3
Baths
1,443
Sq Ft
$738/Sq Ft
Est. Value
About This Home
This home is located at 6864 Maple Leaf Dr, Carlsbad, CA 92011 and is currently estimated at $1,064,402, approximately $737 per square foot. 6864 Maple Leaf Dr is a home located in San Diego County with nearby schools including Pacific Rim Elementary, Aviara Oaks Middle, and Sage Creek High.
Ownership History
Date
Name
Owned For
Owner Type
Purchase Details
Closed on
Dec 30, 2011
Sold by
Seaver Sheila
Bought by
Seaver Sheila
Current Estimated Value
Home Financials for this Owner
Home Financials are based on the most recent Mortgage that was taken out on this home.
Original Mortgage
$157,862
Outstanding Balance
$18,087
Interest Rate
3.93%
Mortgage Type
New Conventional
Estimated Equity
$1,046,315
Purchase Details
Closed on
Sep 14, 2005
Sold by
Galey John A and Galey Shirley B
Bought by
Levene Howard
Home Financials for this Owner
Home Financials are based on the most recent Mortgage that was taken out on this home.
Original Mortgage
$459,000
Outstanding Balance
$254,746
Interest Rate
6.45%
Mortgage Type
Fannie Mae Freddie Mac
Estimated Equity
$809,656
Purchase Details
Closed on
Jul 27, 1987
Create a Home Valuation Report for This Property
The Home Valuation Report is an in-depth analysis detailing your home's value as well as a comparison with similar homes in the area
Home Values in the Area
Average Home Value in this Area
Purchase History
| Date | Buyer | Sale Price | Title Company |
|---|---|---|---|
| Seaver Sheila | -- | Accommodation | |
| Seaver Sheila | -- | Lsi | |
| Levene Howard | $510,000 | New Century Title Company | |
| -- | $122,000 | -- |
Source: Public Records
Mortgage History
| Date | Status | Borrower | Loan Amount |
|---|---|---|---|
| Open | Seaver Sheila | $157,862 | |
| Open | Levene Howard | $459,000 |
Source: Public Records
Tax History
| Year | Tax Paid | Tax Assessment Tax Assessment Total Assessment is a certain percentage of the fair market value that is determined by local assessors to be the total taxable value of land and additions on the property. | Land | Improvement |
|---|---|---|---|---|
| 2025 | $2,417 | $232,519 | $79,412 | $153,107 |
| 2024 | $2,417 | $227,960 | $77,855 | $150,105 |
| 2023 | $2,402 | $223,491 | $76,329 | $147,162 |
| 2022 | $2,364 | $219,110 | $74,833 | $144,277 |
| 2021 | $2,345 | $214,815 | $73,366 | $141,449 |
| 2020 | $2,329 | $212,613 | $72,614 | $139,999 |
| 2019 | $2,286 | $208,445 | $71,191 | $137,254 |
| 2018 | $2,190 | $204,359 | $69,796 | $134,563 |
| 2017 | $90 | $200,353 | $68,428 | $131,925 |
| 2016 | $2,065 | $196,426 | $67,087 | $129,339 |
| 2015 | $2,056 | $193,477 | $66,080 | $127,397 |
| 2014 | $2,021 | $189,688 | $64,786 | $124,902 |
Source: Public Records
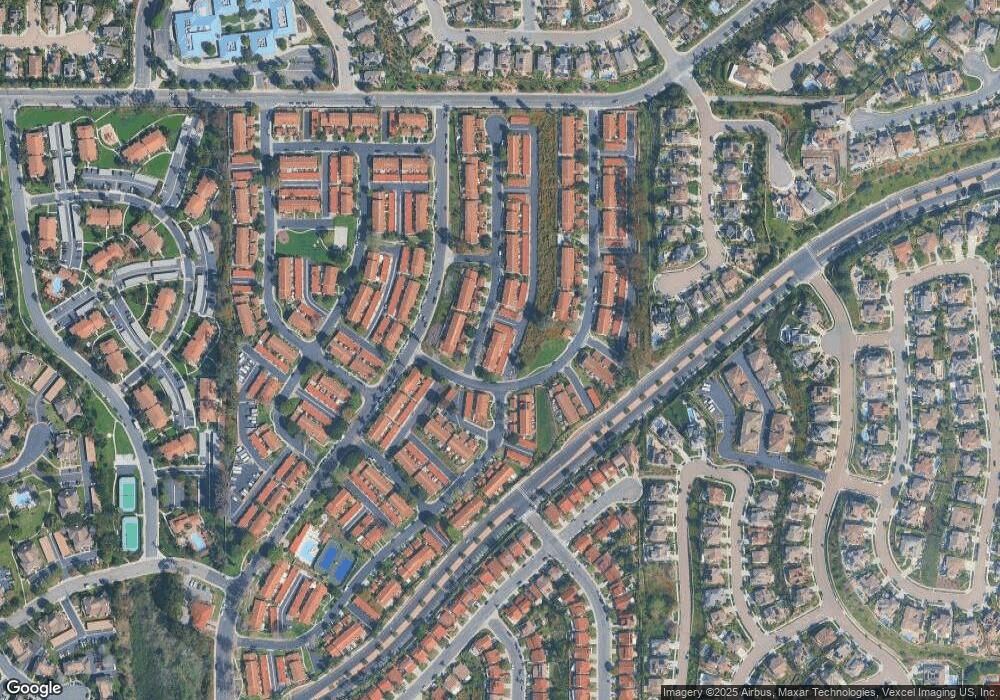
Map
Nearby Homes
- 907 Hickory Ct Unit 5
- 6819 Alderwood Dr
- 948 Alyssum Rd
- 6990 Batiquitos Dr Unit 1
- 857 Violet Ct
- 6927 Wildrose Terrace
- 6871 Seaspray Ln
- 7009 Wildrose Terrace
- 7011 Wildrose Terrace
- 7102 Linden Terrace
- 6729 Hyacinth Cir
- 901 Caminito Estrada Unit C
- 7215 Daffodil Place
- 908 Caminito Madrigal Unit F
- 7137 Rockrose Terrace
- 6801 Embarcadero Ln
- 7025 San Bartolo St Unit 42
- 7243 San Luis St Unit 257
- 7218 San Lucas St Unit 189
- 7207 Santa Barbara St Unit 154
- 6862 Maple Leaf Dr
- 6866 Maple Leaf Dr
- 6868 Maple Leaf Dr
- 6860 Maple Leaf Dr Unit 7
- 6870 Maple Leaf Dr
- 6865 Maple Leaf Dr
- 6863 Maple Leaf Dr Unit 7
- 6861 Maple Leaf Dr
- 6859 Maple Leaf Dr
- 6869 Maple Leaf Dr
- 6858 Maple Leaf Dr
- 6855 Maple Leaf Dr
- 6863 Peach Tree Rd
- 6853 Maple Leaf Dr
- 6862 Peach Tree Rd
- 6856 Maple Leaf Dr
- 6851 Maple Leaf Dr
- 6865 Peach Tree Rd Unit 7
- 6854 Maple Leaf Dr
- 6849 Maple Leaf Dr
Your Personal Tour Guide
Ask me questions while you tour the home.