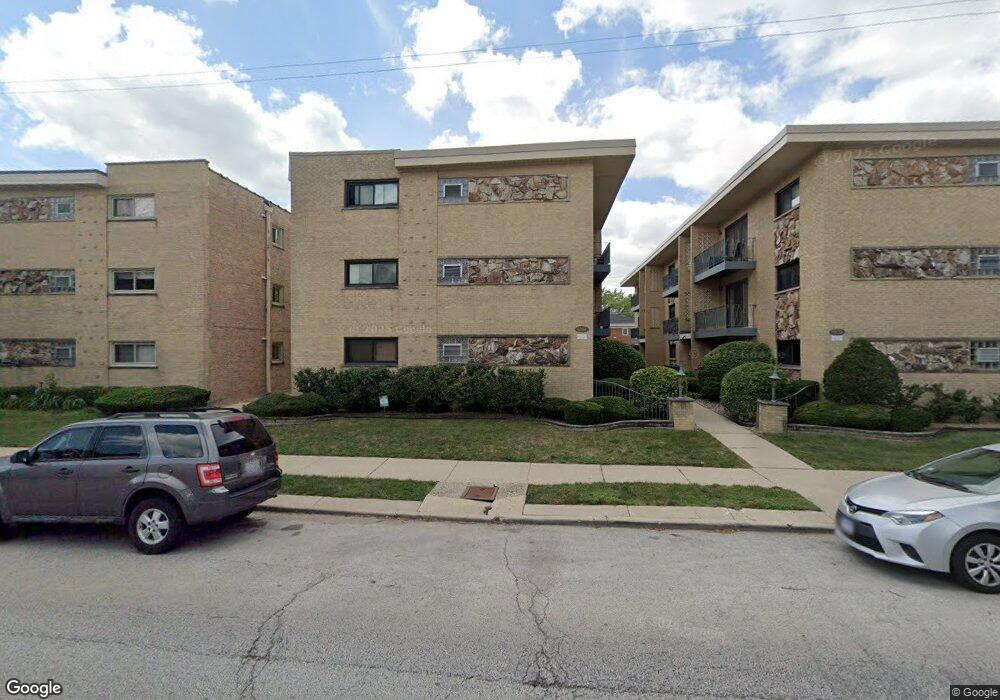
6864 N Northwest Hwy Unit 2C Chicago, IL 60631
Edison Park NeighborhoodEstimated Value: $208,463 - $230,000
2
Beds
1
Bath
11,910
Sq Ft
$18/Sq Ft
Est. Value
About This Home
This home is located at 6864 N Northwest Hwy Unit 2C, Chicago, IL 60631 and is currently estimated at $216,116, approximately $18 per square foot. 6864 N Northwest Hwy Unit 2C is a home located in Cook County with nearby schools including Ebinger Elementary School, Taft High School, and St. Paul of the Cross School.
Ownership History
Date
Name
Owned For
Owner Type
Purchase Details
Closed on
Jun 16, 2017
Sold by
Sullivan Joseph and Sullivan Kenneth
Bought by
Skarzynski Malgorzata and Skarzynski Jan
Current Estimated Value
Purchase Details
Closed on
Jul 13, 2004
Sold by
Lazzara Alexia E
Bought by
Sullivan Mary E
Home Financials for this Owner
Home Financials are based on the most recent Mortgage that was taken out on this home.
Original Mortgage
$50,100
Interest Rate
5.81%
Mortgage Type
Purchase Money Mortgage
Purchase Details
Closed on
Sep 9, 1999
Sold by
Holysz Gregory R and Holysz Mark V
Bought by
Lazzara Alexia E
Home Financials for this Owner
Home Financials are based on the most recent Mortgage that was taken out on this home.
Original Mortgage
$104,400
Interest Rate
7.9%
Create a Home Valuation Report for This Property
The Home Valuation Report is an in-depth analysis detailing your home's value as well as a comparison with similar homes in the area
Home Values in the Area
Average Home Value in this Area
Purchase History
| Date | Buyer | Sale Price | Title Company |
|---|---|---|---|
| Skarzynski Malgorzata | $153,000 | Old Republic Title | |
| Sullivan Mary E | $183,000 | Attorneys Title Guaranty Fun | |
| Lazzara Alexia E | $116,000 | -- |
Source: Public Records
Mortgage History
| Date | Status | Borrower | Loan Amount |
|---|---|---|---|
| Previous Owner | Sullivan Mary E | $50,100 | |
| Previous Owner | Lazzara Alexia E | $104,400 |
Source: Public Records
Tax History Compared to Growth
Tax History
| Year | Tax Paid | Tax Assessment Tax Assessment Total Assessment is a certain percentage of the fair market value that is determined by local assessors to be the total taxable value of land and additions on the property. | Land | Improvement |
|---|---|---|---|---|
| 2024 | $3,335 | $18,307 | $2,422 | $15,885 |
| 2023 | $3,251 | $15,810 | $1,938 | $13,872 |
| 2022 | $3,251 | $15,810 | $1,938 | $13,872 |
| 2021 | $3,179 | $15,808 | $1,937 | $13,871 |
| 2020 | $3,079 | $13,823 | $1,307 | $12,516 |
| 2019 | $3,074 | $15,299 | $1,307 | $13,992 |
| 2018 | $3,022 | $15,299 | $1,307 | $13,992 |
| 2017 | $1,973 | $12,540 | $1,162 | $11,378 |
| 2016 | $2,011 | $12,540 | $1,162 | $11,378 |
| 2015 | $1,817 | $12,540 | $1,162 | $11,378 |
| 2014 | $2,000 | $13,346 | $1,016 | $12,330 |
| 2013 | $1,949 | $13,346 | $1,016 | $12,330 |
Source: Public Records
Map
Nearby Homes
- 6852 N Northwest Hwy Unit 2B
- 6858 N Northwest Hwy Unit 2E
- 400 S Northwest Hwy Unit 312B
- 460 S Northwest Hwy Unit 307A
- 6919 N Overhill Ave
- 6724 N Avondale Ave
- 311 S Northwest Hwy Unit 4
- 7039 N Ottawa Ave
- 6681 N Northwest Hwy
- 7062 N Oriole Ave
- 249 S Vine Ave Unit B
- 6854 N Osceola Ave
- 6625 N Northwest Hwy Unit 202
- 1021 Cleveland Ave
- 7005 N Osceola Ave
- 6727 N Oketo Ave
- 320 Grant Place
- 7255 N Oriole Ave
- 7246 N Oleander Ave
- 7324 W Lunt Ave
- 6864 N Northwest Hwy Unit 2A
- 6864 N Northwest Hwy Unit 1C
- 6864 N Northwest Hwy Unit 2B
- 6864 N Northwest Hwy Unit 3A
- 6864 N Northwest Hwy Unit 3B
- 6864 N Northwest Hwy Unit 3C
- 6870 N Northwest Hwy Unit HWY2F
- 6870 N Northwest Hwy Unit 2D
- 6870 N Northwest Hwy Unit 3E
- 6870 N Northwest Hwy Unit 3D
- 6870 N Northwest Hwy Unit 3F
- 6870 N Northwest Hwy Unit 1E
- 6870 N Northwest Hwy Unit 2F
- 6870 N Northwest Hwy Unit 2E
- 6870 N Northwest Hwy Unit 1D
- 6870 N Northwest Hwy Unit 1F
- 6874 N Northwest Hwy
- 510 S Northwest Hwy
- 6872 N Northwest Hwy
- 6852 N Northwest Hwy Unit 1A