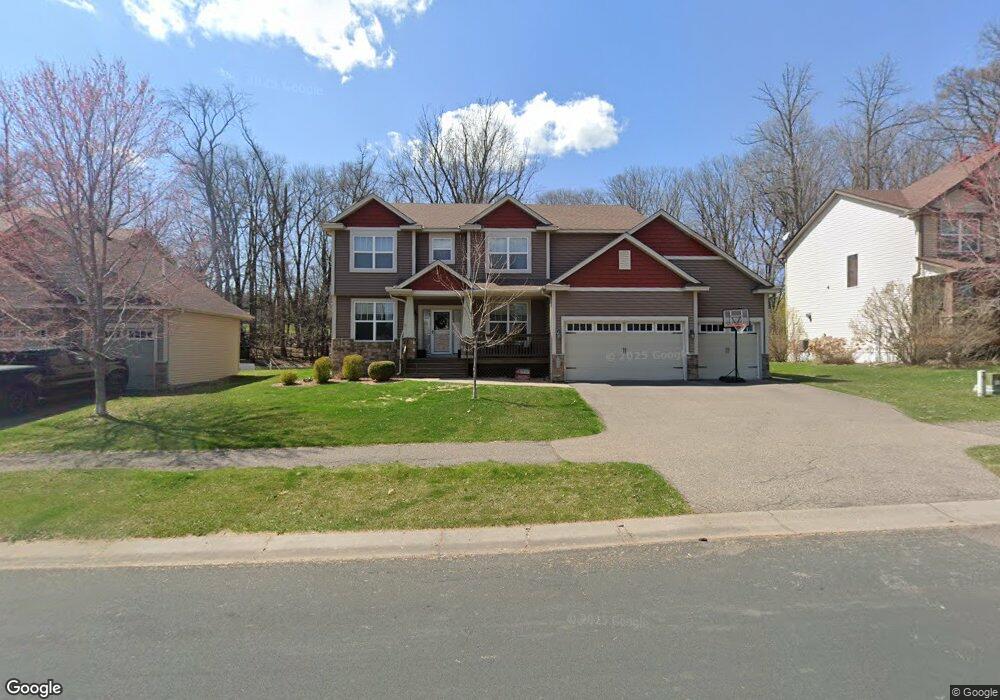
6869 Garland Ln N Maple Grove, MN 55311
Estimated Value: $667,000 - $812,000
5
Beds
4
Baths
2,904
Sq Ft
$252/Sq Ft
Est. Value
About This Home
This home is located at 6869 Garland Ln N, Maple Grove, MN 55311 and is currently estimated at $731,819, approximately $252 per square foot. 6869 Garland Ln N is a home located in Hennepin County with nearby schools including Basswood Elementary School, Maple Grove Middle School, and Maple Grove Senior High School.
Ownership History
Date
Name
Owned For
Owner Type
Purchase Details
Closed on
Mar 13, 2020
Sold by
Onyshuk Joe and Onyshuk Carica
Bought by
Gamass Joel and Garnass Brandi
Current Estimated Value
Home Financials for this Owner
Home Financials are based on the most recent Mortgage that was taken out on this home.
Original Mortgage
$489,250
Outstanding Balance
$432,474
Interest Rate
3.4%
Mortgage Type
New Conventional
Estimated Equity
$299,345
Purchase Details
Closed on
Mar 5, 2018
Sold by
Nowak Matthew P and Nowak Tennille E
Bought by
Onyshuk Joel and Onyshuk Carica
Purchase Details
Closed on
Jun 15, 2009
Sold by
Minks Custom Homes Inc
Bought by
Nowak Matthew P and Nowak Tennille E
Purchase Details
Closed on
Sep 30, 2008
Sold by
Ryan Development Inc
Bought by
Minks Custom Homes Inc
Create a Home Valuation Report for This Property
The Home Valuation Report is an in-depth analysis detailing your home's value as well as a comparison with similar homes in the area
Home Values in the Area
Average Home Value in this Area
Purchase History
| Date | Buyer | Sale Price | Title Company |
|---|---|---|---|
| Gamass Joel | $515,000 | Chicago Title Ins Ins Co | |
| Onyshuk Joel | $479,900 | All American Title Co | |
| Nowak Matthew P | $395,000 | -- | |
| Minks Custom Homes Inc | $895,000 | -- |
Source: Public Records
Mortgage History
| Date | Status | Borrower | Loan Amount |
|---|---|---|---|
| Open | Gamass Joel | $489,250 | |
| Closed | Onyshuk Joel | $0 |
Source: Public Records
Tax History Compared to Growth
Tax History
| Year | Tax Paid | Tax Assessment Tax Assessment Total Assessment is a certain percentage of the fair market value that is determined by local assessors to be the total taxable value of land and additions on the property. | Land | Improvement |
|---|---|---|---|---|
| 2024 | $8,014 | $632,500 | $164,900 | $467,600 |
| 2023 | $7,498 | $616,500 | $139,900 | $476,600 |
| 2022 | $6,345 | $612,800 | $123,400 | $489,400 |
| 2021 | $5,940 | $518,900 | $126,700 | $392,200 |
| 2020 | $6,135 | $481,300 | $101,700 | $379,600 |
| 2019 | $6,609 | $472,000 | $106,700 | $365,300 |
| 2018 | $6,291 | $479,900 | $136,500 | $343,400 |
| 2017 | $6,167 | $421,100 | $122,000 | $299,100 |
| 2016 | $6,101 | $410,700 | $120,000 | $290,700 |
| 2015 | $6,095 | $399,100 | $115,000 | $284,100 |
| 2014 | -- | $368,500 | $115,000 | $253,500 |
Source: Public Records
Map
Nearby Homes
- 6726 Fountain Ln N
- 17225 72nd Ave N Unit 2001
- 6829 Narcissus Ln N Unit 304
- 17390 72nd Ave N Unit 1301
- 7087 Merrimac Ln N
- 17700 71st Ave N
- 17812 66th Ave N
- 16322 70th Ave N Unit 204
- 17716 Elm Rd N
- 16236 70th Place N
- 6647 Peony Ln N
- 6324 Fountain Ln N
- 6413 Archer Ln N
- 18165 67th Place N
- 7099 Weston Ln N
- 7082 Weston Ln N
- 7094 Weston Ln N
- 6848 Troy Ln N
- 18302 66th Place N
- 6757 Urbandale Ln N
- 6869 Garland Ln N
- 6857 Garland Ln N
- 6881 Garland Ln N
- 6881 Garland Ln N
- 6835 Garland Ln N
- 6835 Garland Ln N
- 17010 68th Place N
- 17010 68th Place N
- 17010 68th Place N
- 6893 Garland Ln N
- 6893 Garland Ln N
- 6823 Garland Ln N
- 6823 Garland Ln N
- 17015 68th Place N
- 17015 68th Place N
- 16958 68th Place N
- 6905 Garland Ln N
- 6905 Garland Ln N
- 16916 68th Place N
- 16993 68th Place N