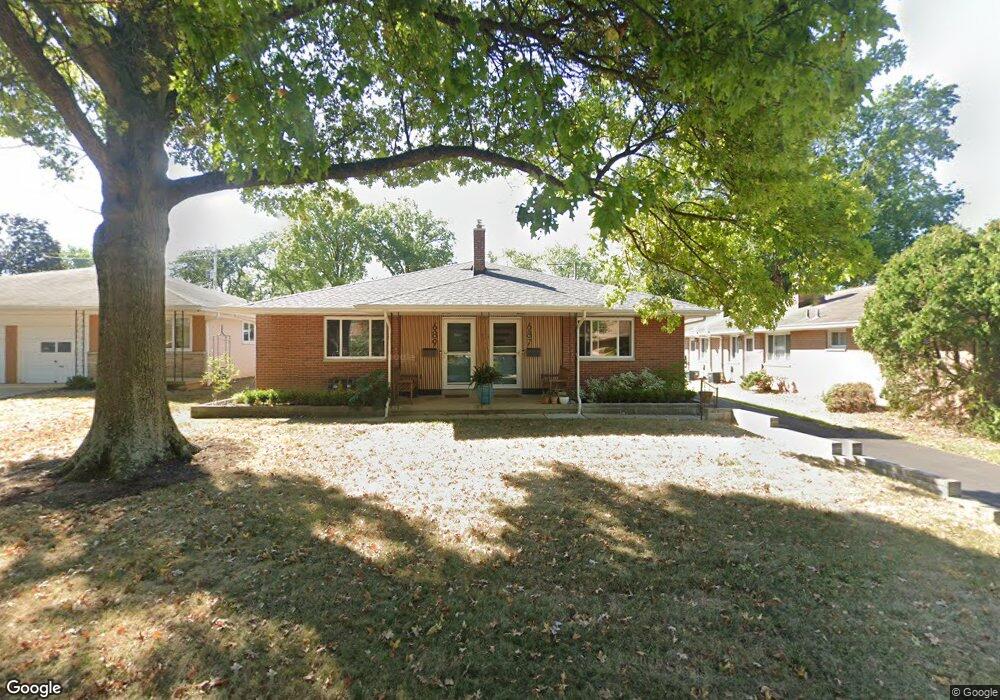
687-689 E Schreyer Place Columbus, OH 43214
Clintonville NeighborhoodEstimated Value: $405,000 - $527,000
4
Beds
3
Baths
2,050
Sq Ft
$227/Sq Ft
Est. Value
About This Home
This home is located at 687-689 E Schreyer Place, Columbus, OH 43214 and is currently estimated at $466,177, approximately $227 per square foot. 687-689 E Schreyer Place is a home located in Franklin County with nearby schools including Colerain Elementary School, Dominion Middle School, and Whetstone High School.
Ownership History
Date
Name
Owned For
Owner Type
Purchase Details
Closed on
Oct 29, 2020
Sold by
Schuster Deborah J and Schuster Larry L
Bought by
Dickerson Ronald L
Current Estimated Value
Home Financials for this Owner
Home Financials are based on the most recent Mortgage that was taken out on this home.
Original Mortgage
$272,000
Outstanding Balance
$242,041
Interest Rate
2.8%
Mortgage Type
New Conventional
Estimated Equity
$224,136
Purchase Details
Closed on
Sep 30, 2020
Sold by
Estate Of Emogene Anderson
Bought by
Schuster Deborah J and Anderson Robert W
Home Financials for this Owner
Home Financials are based on the most recent Mortgage that was taken out on this home.
Original Mortgage
$272,000
Outstanding Balance
$242,041
Interest Rate
2.8%
Mortgage Type
New Conventional
Estimated Equity
$224,136
Purchase Details
Closed on
Aug 30, 2005
Sold by
Winkel Robert A
Bought by
Anderson Homer W and Anderson Emogene
Purchase Details
Closed on
Aug 22, 1996
Sold by
Fleshman Marie
Bought by
Winkel Robert J and Winkel Frances J
Create a Home Valuation Report for This Property
The Home Valuation Report is an in-depth analysis detailing your home's value as well as a comparison with similar homes in the area
Home Values in the Area
Average Home Value in this Area
Purchase History
| Date | Buyer | Sale Price | Title Company |
|---|---|---|---|
| Dickerson Ronald L | $320,000 | Ohio Signature Title | |
| Schuster Deborah J | -- | None Available | |
| Anderson Homer W | $225,000 | Title Co Lt | |
| Winkel Robert J | $90,000 | -- |
Source: Public Records
Mortgage History
| Date | Status | Borrower | Loan Amount |
|---|---|---|---|
| Open | Dickerson Ronald L | $272,000 |
Source: Public Records
Tax History Compared to Growth
Tax History
| Year | Tax Paid | Tax Assessment Tax Assessment Total Assessment is a certain percentage of the fair market value that is determined by local assessors to be the total taxable value of land and additions on the property. | Land | Improvement |
|---|---|---|---|---|
| 2024 | $6,067 | $133,780 | $36,440 | $97,340 |
| 2023 | $5,991 | $133,780 | $36,440 | $97,340 |
| 2022 | $5,602 | $106,690 | $30,630 | $76,060 |
| 2021 | $5,612 | $106,690 | $30,630 | $76,060 |
| 2020 | $5,688 | $106,690 | $30,630 | $76,060 |
| 2019 | $5,104 | $82,080 | $23,560 | $58,520 |
| 2018 | $5,007 | $82,080 | $23,560 | $58,520 |
| 2017 | $5,103 | $82,080 | $23,560 | $58,520 |
| 2016 | $5,402 | $79,520 | $18,970 | $60,550 |
| 2015 | $4,918 | $79,520 | $18,970 | $60,550 |
| 2014 | $4,930 | $79,520 | $18,970 | $60,550 |
| 2013 | $2,316 | $75,740 | $18,060 | $57,680 |
Source: Public Records
Map
Nearby Homes
- 4266 Fairoaks Dr
- 4193 Eastlea Dr
- 4299 Colerain Ave
- 814 Meadowview Dr
- 685 Yaronia Dr N
- 4000 Indianola Ave
- 411 Garden Rd
- 4508 Glenmawr Ave
- 522 E Beechwold Blvd
- 340 Canyon Dr S
- 518 E Royal Forest Blvd
- 1064 Hillsdale Dr
- 3938 Eisenhower Rd
- 601 Morse Rd
- 597 Morse Rd
- 541 Northridge Rd
- 958 Janet Dr
- 995 Overbrook Service Dr
- 4441 Wetmore Rd E
- 1130 Carbone Dr
- 687 E Schreyer Place Unit 689
- 695 E Schreyer Place Unit 697
- 4298 Eastlea Dr Unit 300
- 703-705 E Schreyer Place
- 703 E Schreyer Place Unit 705
- 690 Springs Dr Unit 692
- 698 Springs Dr Unit 700
- 711 E Schreyer Place Unit 713
- 688 E Schreyer Place
- 706 Springs Dr Unit 708
- 706 Springs Dr Unit 2
- 680 E Schreyer Place
- 4289 Eastlea Dr
- 704 E Schreyer Place
- 4299 Eastlea Dr
- 4279 Eastlea Dr
- 672 E Schreyer Place
- 712 Springs Dr Unit 716
- 4269 Eastlea Dr
- 664 E Schreyer Place