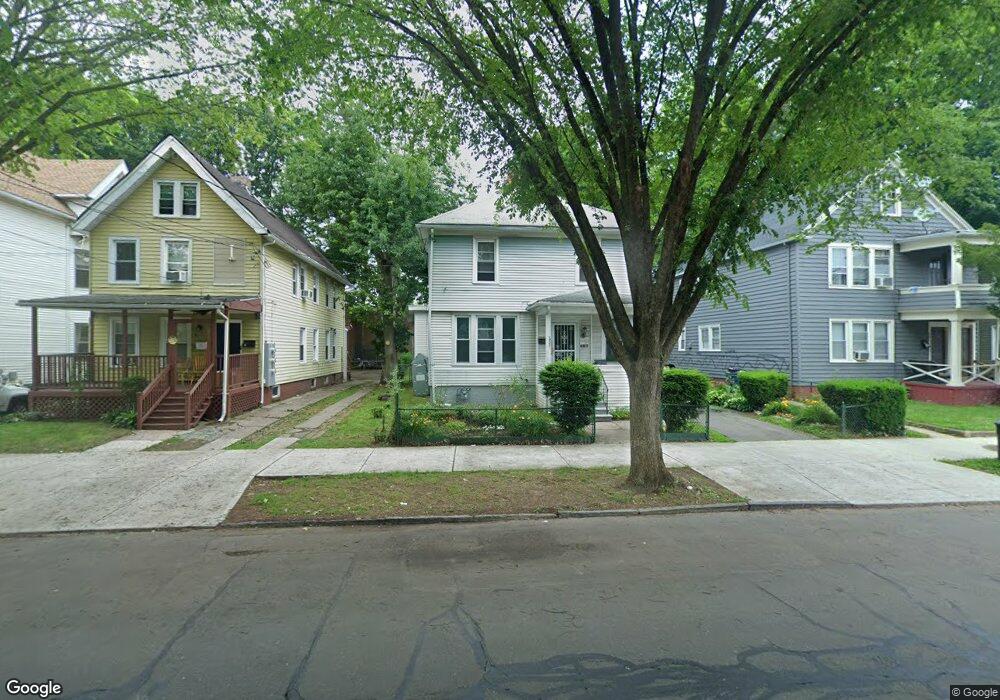
687 Elm St New Haven, CT 06511
Edgewood NeighborhoodEstimated Value: $314,000 - $439,000
4
Beds
2
Baths
1,805
Sq Ft
$215/Sq Ft
Est. Value
About This Home
This home is located at 687 Elm St, New Haven, CT 06511 and is currently estimated at $387,652, approximately $214 per square foot. 687 Elm St is a home located in New Haven County with nearby schools including Amistad Academy and Yeshiva Gedolah Rabbinical Inst.
Ownership History
Date
Name
Owned For
Owner Type
Purchase Details
Closed on
Jul 22, 2020
Sold by
Skyers Erell
Bought by
Skyers Sharon
Current Estimated Value
Purchase Details
Closed on
Dec 8, 2004
Sold by
Laiwhorn Thelma
Bought by
Skyers Errel N
Home Financials for this Owner
Home Financials are based on the most recent Mortgage that was taken out on this home.
Original Mortgage
$144,000
Interest Rate
5.63%
Create a Home Valuation Report for This Property
The Home Valuation Report is an in-depth analysis detailing your home's value as well as a comparison with similar homes in the area
Home Values in the Area
Average Home Value in this Area
Purchase History
| Date | Buyer | Sale Price | Title Company |
|---|---|---|---|
| Skyers Sharon | -- | None Available | |
| Skyers Errel N | $180,000 | -- |
Source: Public Records
Mortgage History
| Date | Status | Borrower | Loan Amount |
|---|---|---|---|
| Previous Owner | Skyers Errel N | $84,820 | |
| Previous Owner | Skyers Errel N | $199,750 | |
| Previous Owner | Skyers Errel N | $144,000 |
Source: Public Records
Tax History Compared to Growth
Tax History
| Year | Tax Paid | Tax Assessment Tax Assessment Total Assessment is a certain percentage of the fair market value that is determined by local assessors to be the total taxable value of land and additions on the property. | Land | Improvement |
|---|---|---|---|---|
| 2025 | $6,542 | $166,040 | $48,720 | $117,320 |
| 2024 | $6,393 | $166,040 | $48,720 | $117,320 |
| 2023 | $6,177 | $166,040 | $48,720 | $117,320 |
| 2022 | $6,600 | $166,040 | $48,720 | $117,320 |
| 2021 | $5,925 | $135,030 | $42,000 | $93,030 |
| 2020 | $5,925 | $135,030 | $42,000 | $93,030 |
| 2019 | $5,804 | $135,030 | $42,000 | $93,030 |
| 2018 | $5,804 | $135,030 | $42,000 | $93,030 |
| 2017 | $5,223 | $135,030 | $42,000 | $93,030 |
| 2016 | $5,096 | $122,640 | $32,970 | $89,670 |
| 2015 | $5,096 | $122,640 | $32,970 | $89,670 |
| 2014 | $5,096 | $122,640 | $32,970 | $89,670 |
Source: Public Records
Map
Nearby Homes