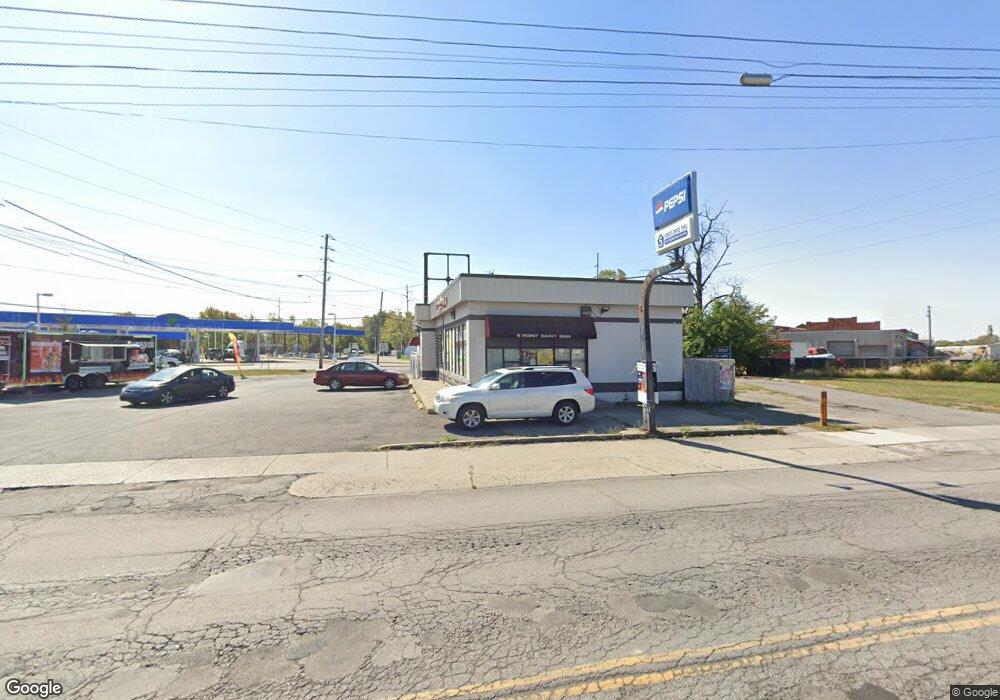
687 Kenton Ave Marion, OH 43302
Estimated Value: $556,770
--
Bed
--
Bath
2,895
Sq Ft
$192/Sq Ft
Est. Value
About This Home
This home is located at 687 Kenton Ave, Marion, OH 43302 and is currently estimated at $556,770, approximately $192 per square foot. 687 Kenton Ave is a home located in Marion County with nearby schools including Rutherford B. Hayes Elementary School, Ulysses S. Grant Middle School, and Harding High School.
Ownership History
Date
Name
Owned For
Owner Type
Purchase Details
Closed on
May 8, 2019
Sold by
Patel Bharat M and Patel Anila B
Bought by
Halah S Llc
Current Estimated Value
Home Financials for this Owner
Home Financials are based on the most recent Mortgage that was taken out on this home.
Original Mortgage
$275,000
Outstanding Balance
$240,793
Interest Rate
4%
Mortgage Type
Unknown
Estimated Equity
$315,977
Purchase Details
Closed on
Oct 12, 2011
Sold by
Kildow Mark Allen
Bought by
Patel Bharat M and Patel Anila B
Home Financials for this Owner
Home Financials are based on the most recent Mortgage that was taken out on this home.
Original Mortgage
$217,045
Interest Rate
4.12%
Mortgage Type
Commercial
Purchase Details
Closed on
Aug 28, 1996
Bought by
Patel Bharat M and Surv Anila B
Create a Home Valuation Report for This Property
The Home Valuation Report is an in-depth analysis detailing your home's value as well as a comparison with similar homes in the area
Home Values in the Area
Average Home Value in this Area
Purchase History
| Date | Buyer | Sale Price | Title Company |
|---|---|---|---|
| Halah S Llc | $275,000 | None Available | |
| Patel Bharat M | $290,000 | None Available | |
| Patel Bharat M | -- | -- | |
| Patel Bharat M | $61,500 | -- |
Source: Public Records
Mortgage History
| Date | Status | Borrower | Loan Amount |
|---|---|---|---|
| Open | Halah S Llc | $275,000 | |
| Previous Owner | Patel Bharat M | $217,045 |
Source: Public Records
Tax History Compared to Growth
Tax History
| Year | Tax Paid | Tax Assessment Tax Assessment Total Assessment is a certain percentage of the fair market value that is determined by local assessors to be the total taxable value of land and additions on the property. | Land | Improvement |
|---|---|---|---|---|
| 2024 | $2,605 | $52,860 | $4,570 | $48,290 |
| 2023 | $2,605 | $52,860 | $4,570 | $48,290 |
| 2022 | $2,991 | $52,860 | $4,570 | $48,290 |
| 2021 | $2,959 | $52,860 | $4,570 | $48,290 |
| 2020 | $3,008 | $52,860 | $4,570 | $48,290 |
| 2019 | $2,831 | $52,860 | $4,570 | $48,290 |
| 2018 | $2,483 | $52,750 | $4,460 | $48,290 |
| 2017 | $2,494 | $52,750 | $4,460 | $48,290 |
| 2016 | $2,505 | $52,750 | $4,460 | $48,290 |
| 2015 | $2,532 | $52,750 | $4,460 | $48,290 |
| 2014 | $2,529 | $52,750 | $4,460 | $48,290 |
| 2012 | $1,908 | $39,250 | $3,020 | $36,230 |
Source: Public Records
Map
Nearby Homes
- 802 W Center St
- 134 Cayuga St
- 707 W Center St
- 731 W Center St
- 124 Cayuga St
- 741 W Center St
- 672 Hocking St
- 686 Hocking St(p)
- 686 Hocking St
- 749 W Center St
- 126 Cayuga St
- 174 Edwards St
- 181 Edwards St
- 125 Cayuga St
- 753 W Center St
- 178 Edwards St
- 127 Cayuga St
- 187 Edwards St
- 184 Senate St
- 184 Edwards St