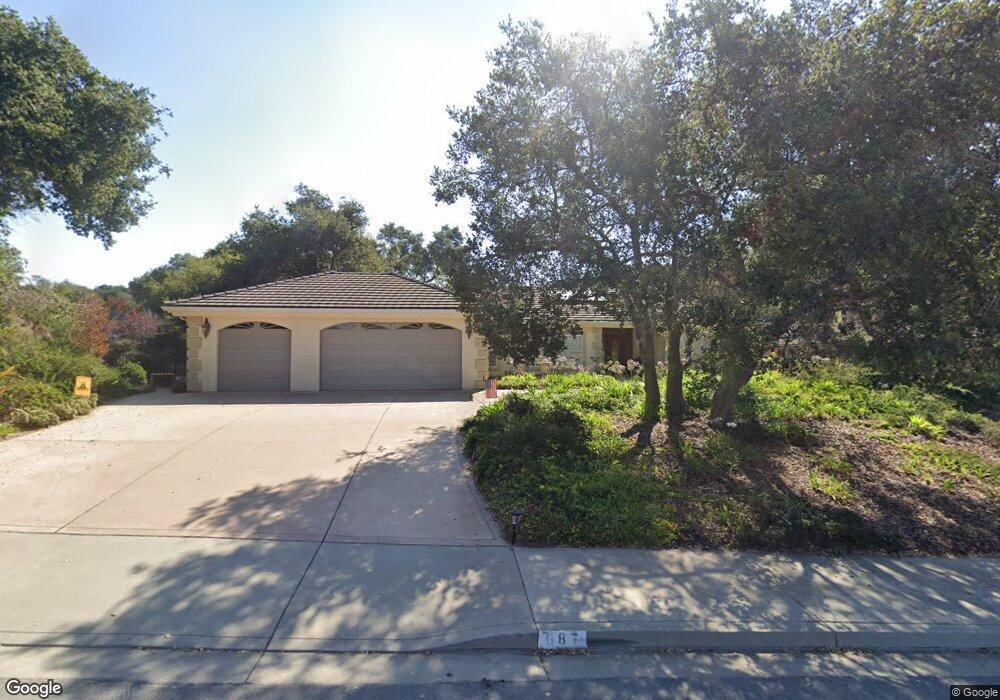
687 Misty Glen Place Nipomo, CA 93444
Blacklake NeighborhoodEstimated Value: $1,132,000 - $1,184,000
3
Beds
3
Baths
2,400
Sq Ft
$477/Sq Ft
Est. Value
About This Home
This home is located at 687 Misty Glen Place, Nipomo, CA 93444 and is currently estimated at $1,145,509, approximately $477 per square foot. 687 Misty Glen Place is a home located in San Luis Obispo County with nearby schools including Dorothea Lange Elementary School, Mesa Middle School, and Nipomo High School.
Ownership History
Date
Name
Owned For
Owner Type
Purchase Details
Closed on
Feb 17, 2012
Sold by
Ng Lip J and Ng Jason J
Bought by
Ng Lip J
Current Estimated Value
Home Financials for this Owner
Home Financials are based on the most recent Mortgage that was taken out on this home.
Original Mortgage
$290,000
Outstanding Balance
$118,105
Interest Rate
3.84%
Mortgage Type
New Conventional
Estimated Equity
$1,027,404
Purchase Details
Closed on
Dec 14, 1999
Sold by
Nester Greg
Bought by
Ng Jason J
Home Financials for this Owner
Home Financials are based on the most recent Mortgage that was taken out on this home.
Original Mortgage
$315,000
Interest Rate
4.95%
Purchase Details
Closed on
Dec 22, 1998
Sold by
Nester Kimberly Ann
Bought by
Nester Greg
Purchase Details
Closed on
Sep 28, 1998
Sold by
Wittstrom Karl Fredrick and Wittstrom Cindy Dee
Bought by
Nester Greg
Create a Home Valuation Report for This Property
The Home Valuation Report is an in-depth analysis detailing your home's value as well as a comparison with similar homes in the area
Home Values in the Area
Average Home Value in this Area
Purchase History
| Date | Buyer | Sale Price | Title Company |
|---|---|---|---|
| Ng Lip J | -- | None Available | |
| Ng Jason J | $350,000 | First American Title Ins Co | |
| Nester Greg | -- | First American Title Ins Co | |
| Nester Greg | $120,000 | First American Title |
Source: Public Records
Mortgage History
| Date | Status | Borrower | Loan Amount |
|---|---|---|---|
| Open | Ng Lip J | $290,000 | |
| Previous Owner | Ng Jason J | $315,000 |
Source: Public Records
Tax History Compared to Growth
Tax History
| Year | Tax Paid | Tax Assessment Tax Assessment Total Assessment is a certain percentage of the fair market value that is determined by local assessors to be the total taxable value of land and additions on the property. | Land | Improvement |
|---|---|---|---|---|
| 2025 | $6,647 | $537,921 | $230,533 | $307,388 |
| 2024 | $6,591 | $527,374 | $226,013 | $301,361 |
| 2023 | $6,591 | $517,034 | $221,582 | $295,452 |
| 2022 | $6,519 | $506,897 | $217,238 | $289,659 |
| 2021 | $5,354 | $496,959 | $212,979 | $283,980 |
| 2020 | $5,292 | $491,865 | $210,796 | $281,069 |
| 2019 | $5,258 | $482,221 | $206,663 | $275,558 |
| 2018 | $5,195 | $472,766 | $202,611 | $270,155 |
| 2017 | $5,091 | $463,497 | $198,639 | $264,858 |
| 2016 | $4,803 | $454,410 | $194,745 | $259,665 |
| 2015 | $4,734 | $447,585 | $191,820 | $255,765 |
| 2014 | $4,558 | $438,818 | $188,063 | $250,755 |
Source: Public Records
Map
Nearby Homes
- 1150 Redberry Place
- 639 Barberry Way
- 1337 Black Sage Cir
- 940 Calle Fresa
- 1225 Dawn Rd
- 1060 Dawn Rd
- 1276 Pomeroy Rd
- 1024 Maggie Ln
- 1354 Trail View Place
- 1084 Emma Ln
- 1010 1012 Upper Los Berros Rd
- 620 Camino Roble
- 1255 Viva Way
- 1441 Vicki Ln
- 961 Jacqueline Place
- 977 Jacqueline Place
- 462 Camino Perillo
- 1539 Vista Tesoro Place
- 615 Sweet Donna Place
- 1147 Vaquero Way
- 695 Misty Glen Place Unit LOT
- 695 Misty Glen Place
- 679 Misty Glen Place Unit LT 3
- 679 Misty Glen Place
- 675 Southridge Ln
- 675 S Ridge Ln
- 671 Misty Glen Place Unit LT 4
- 650 Westgate Ln
- 1111 Middle Ridge Ln
- 663 Misty Glen Place
- 665 Southridge Ln
- 665 S Ridge Ln
- 676 Misty Glen Place
- 670 Southridge Ln
- 670 S Ridge Ln
- 655 Misty Glen Place
- 1085 Willow Rd
- 695 Southridge Ln
- 695 S Ridge Ln