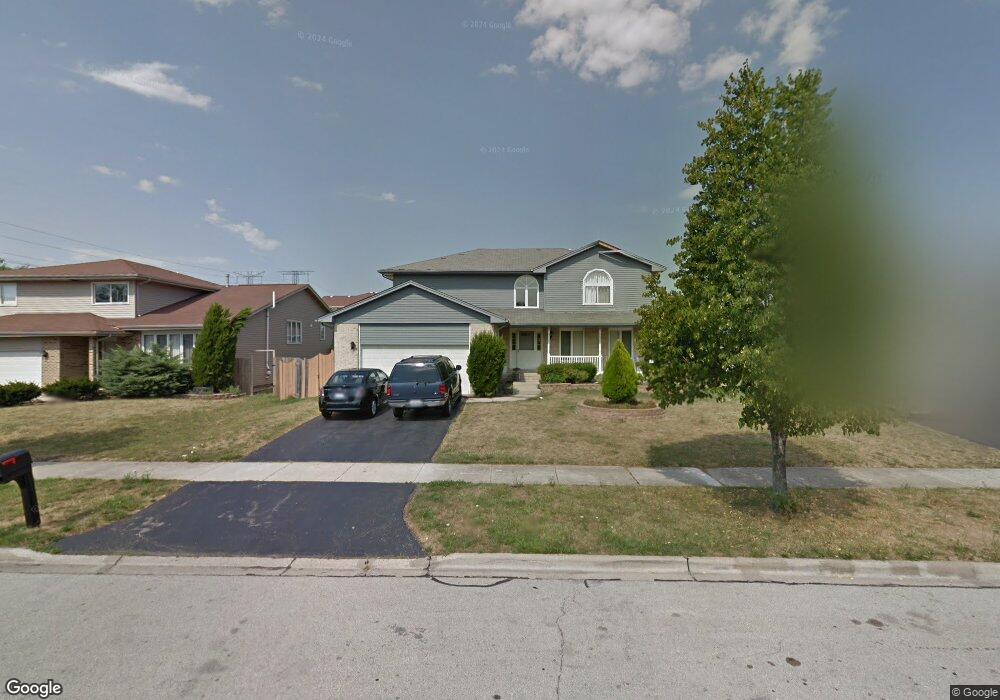
687 N Western Ln Addison, IL 60101
Estimated Value: $469,856 - $517,000
4
Beds
3
Baths
2,383
Sq Ft
$206/Sq Ft
Est. Value
About This Home
This home is located at 687 N Western Ln, Addison, IL 60101 and is currently estimated at $491,214, approximately $206 per square foot. 687 N Western Ln is a home located in DuPage County with nearby schools including Marquardt Middle School, Glenbard East High School, and St Philip The Apostle School.
Ownership History
Date
Name
Owned For
Owner Type
Purchase Details
Closed on
Jul 1, 2013
Sold by
Sanchez Raquel and Sanchez David
Bought by
Sanchez Raquel
Current Estimated Value
Purchase Details
Closed on
Mar 27, 2003
Sold by
Hovance Scott E and Pang Ruth Y
Bought by
Sanchez David and Sanchez Raquel
Home Financials for this Owner
Home Financials are based on the most recent Mortgage that was taken out on this home.
Original Mortgage
$244,000
Outstanding Balance
$106,282
Interest Rate
5.94%
Estimated Equity
$384,932
Create a Home Valuation Report for This Property
The Home Valuation Report is an in-depth analysis detailing your home's value as well as a comparison with similar homes in the area
Home Values in the Area
Average Home Value in this Area
Purchase History
| Date | Buyer | Sale Price | Title Company |
|---|---|---|---|
| Sanchez Raquel | -- | None Available | |
| Sanchez David | $305,000 | Multiple |
Source: Public Records
Mortgage History
| Date | Status | Borrower | Loan Amount |
|---|---|---|---|
| Open | Sanchez David | $244,000 |
Source: Public Records
Tax History Compared to Growth
Tax History
| Year | Tax Paid | Tax Assessment Tax Assessment Total Assessment is a certain percentage of the fair market value that is determined by local assessors to be the total taxable value of land and additions on the property. | Land | Improvement |
|---|---|---|---|---|
| 2024 | $11,325 | $126,037 | $30,148 | $95,889 |
| 2023 | $10,612 | $115,260 | $27,570 | $87,690 |
| 2022 | $12,142 | $122,620 | $27,390 | $95,230 |
| 2021 | $11,848 | $116,500 | $26,020 | $90,480 |
| 2020 | $11,252 | $113,650 | $25,380 | $88,270 |
| 2019 | $10,796 | $109,220 | $24,390 | $84,830 |
| 2018 | $10,638 | $99,730 | $23,750 | $75,980 |
| 2017 | $10,105 | $92,430 | $22,010 | $70,420 |
| 2016 | $10,563 | $92,980 | $22,140 | $70,840 |
| 2015 | $11,844 | $98,270 | $23,400 | $74,870 |
| 2014 | $9,794 | $81,890 | $19,500 | $62,390 |
| 2013 | $9,864 | $84,700 | $20,170 | $64,530 |
Source: Public Records
Map
Nearby Homes
- 941 N Swift Rd Unit 301
- 881 N Swift Rd Unit 206
- 22W070 Byron Ave
- 823 N Harrow Ct
- 818 N Rumple Ln
- 823 N Cambridge Row
- 953 N Rohlwing Rd Unit GB
- 943 N Rohlwing Rd Unit 101H
- 1750 W Woodland Ave
- 323 Morningside Dr Unit B
- 367 Golfview Ct
- 316 Morningside Dr Unit A
- 2 Willow Bridge Way
- 20W561 Army Trail Blvd
- 1527 W Holtz Ave
- 5N260 Eagle Terrace
- 251 Signature Dr
- 1660 W Prescott Place
- 224 Oakwood Ln
- 5N210 Central Rd
- 683 N Western Ln
- 689 N Western Ln
- 2157 W Adobe Dr
- 679 N Western Ln
- 686 N Katherine Ln
- 2151 W Adobe Dr
- 680 N Katherine Ln
- 694 N Western Ln
- 671 N Western Ln
- 696 N Western Ln
- 696 N Western Ln Unit 1
- 678 N Katherine Ln
- 698 N Western Ln
- 2168 W Adobe Dr
- 2166 W Adobe Dr Unit 2166
- 2172 W Adobe Dr
- 2156 W Adobe Dr
- 2164 W Adobe Dr
- 2154 W Adobe Dr