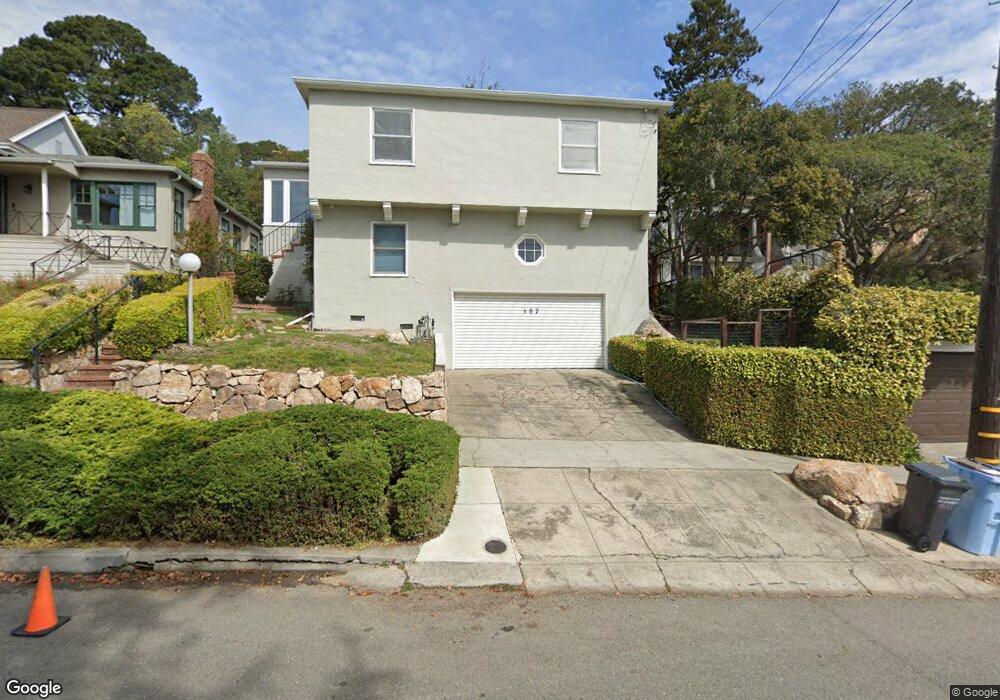
687 The Alameda Berkeley, CA 94707
Thousand Oaks NeighborhoodEstimated Value: $1,634,000 - $2,015,000
4
Beds
3
Baths
1,829
Sq Ft
$997/Sq Ft
Est. Value
About This Home
This home is located at 687 The Alameda, Berkeley, CA 94707 and is currently estimated at $1,823,237, approximately $996 per square foot. 687 The Alameda is a home located in Alameda County with nearby schools including Thousand Oaks Elementary School, Ruth Acty Elementary, and Berkeley Arts Magnet at Whittier School.
Ownership History
Date
Name
Owned For
Owner Type
Purchase Details
Closed on
Feb 5, 2021
Sold by
Sullivan Jolanda Maria and Sullivan George T
Bought by
Sullivan Jolanda Maria and Surviving Spouses Tr Under Geo
Current Estimated Value
Home Financials for this Owner
Home Financials are based on the most recent Mortgage that was taken out on this home.
Original Mortgage
$303,000
Outstanding Balance
$270,766
Interest Rate
2.65%
Mortgage Type
New Conventional
Estimated Equity
$1,552,471
Purchase Details
Closed on
Nov 7, 2008
Sold by
Sullivan George T and Sullivan Jolanda Maria
Bought by
Sullivan George T and Sullivan Jolanda Maria
Purchase Details
Closed on
Jun 22, 2000
Sold by
Steward David S and Steward Margaret S
Bought by
Sullivan George T and Sullivan Jolanda
Home Financials for this Owner
Home Financials are based on the most recent Mortgage that was taken out on this home.
Original Mortgage
$488,000
Interest Rate
8.67%
Create a Home Valuation Report for This Property
The Home Valuation Report is an in-depth analysis detailing your home's value as well as a comparison with similar homes in the area
Home Values in the Area
Average Home Value in this Area
Purchase History
| Date | Buyer | Sale Price | Title Company |
|---|---|---|---|
| Sullivan Jolanda Maria | -- | Old Republic Title Company | |
| Sullivan George T | -- | None Available | |
| Sullivan George T | -- | None Available | |
| Sullivan George T | $610,000 | Old Republic Title Company |
Source: Public Records
Mortgage History
| Date | Status | Borrower | Loan Amount |
|---|---|---|---|
| Open | Sullivan Jolanda Maria | $303,000 | |
| Closed | Sullivan George T | $488,000 |
Source: Public Records
Tax History
| Year | Tax Paid | Tax Assessment Tax Assessment Total Assessment is a certain percentage of the fair market value that is determined by local assessors to be the total taxable value of land and additions on the property. | Land | Improvement |
|---|---|---|---|---|
| 2025 | $15,122 | $930,502 | $281,250 | $656,252 |
| 2024 | $15,122 | $912,123 | $275,737 | $643,386 |
| 2023 | $14,796 | $901,103 | $270,331 | $630,772 |
| 2022 | $14,507 | $876,438 | $265,031 | $618,407 |
| 2021 | $14,528 | $859,120 | $259,836 | $606,284 |
| 2020 | $13,689 | $857,244 | $257,173 | $600,071 |
| 2019 | $13,087 | $840,438 | $252,131 | $588,307 |
| 2018 | $12,853 | $823,963 | $247,189 | $576,774 |
| 2017 | $12,407 | $807,810 | $242,343 | $565,467 |
| 2016 | $11,970 | $791,974 | $237,592 | $554,382 |
| 2015 | $11,803 | $780,080 | $234,024 | $546,056 |
| 2014 | $11,655 | $764,798 | $229,439 | $535,359 |
Source: Public Records
Map
Nearby Homes
- 1858 San Lorenzo Ave
- 1983 Yosemite Rd
- 491 Vincente Ave
- 753 Peralta Ave
- 589 San Luis Rd
- 765 San Diego Rd
- 415 Berkeley Park Blvd
- 483 Boynton Ave
- 813 San Diego Rd
- 450 Vermont Ave
- 731 Santa fe Ave
- 758 Spruce St
- 380 Vermont Ave
- 118 Ramona Ave
- 614 Cragmont Ave
- 777 Cragmont Ave
- 470 Spruce St
- 145 Ramona Ave
- 1741 Sonoma Ave
- 255 Stanford Ave
- 683 The Alameda
- 691 The Alameda
- 679 The Alameda
- 690 The Alameda
- 705 The Alameda
- 671 The Alameda
- 1883 San Lorenzo Ave
- 680 The Alameda
- 1864 Yosemite Rd
- 1875 San Lorenzo Ave
- 663 The Alameda
- 1874 Yosemite Rd
- 715 The Alameda
- 670 The Alameda
- 1869 San Lorenzo Ave
- 700 The Alameda
- 1888 San Lorenzo Ave
- 1844 Yosemite Rd
- 651 The Alameda
- 666 The Alameda
Your Personal Tour Guide
Ask me questions while you tour the home.