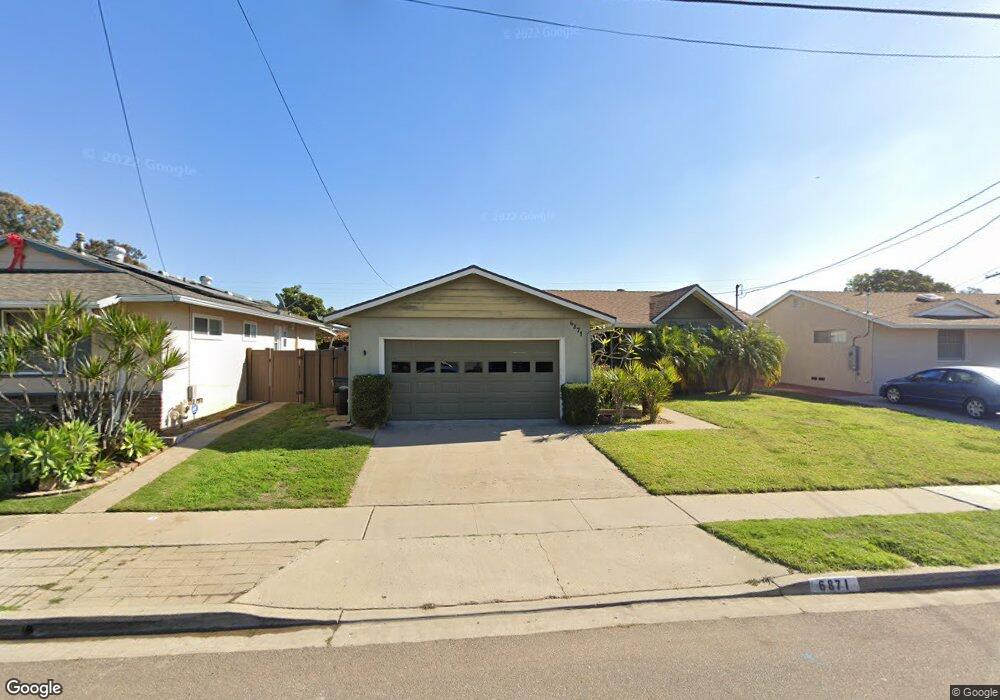
6871 51st St San Diego, CA 92120
Allied Gardens NeighborhoodEstimated Value: $935,112 - $980,000
3
Beds
2
Baths
1,232
Sq Ft
$783/Sq Ft
Est. Value
About This Home
This home is located at 6871 51st St, San Diego, CA 92120 and is currently estimated at $964,278, approximately $782 per square foot. 6871 51st St is a home located in San Diego County with nearby schools including Foster Elementary School, Lewis Middle School, and Patrick Henry High School.
Ownership History
Date
Name
Owned For
Owner Type
Purchase Details
Closed on
Jan 24, 2014
Sold by
Williams Erin E and Williams Garrett A
Bought by
Williams Garrett A and Williams Erin E
Current Estimated Value
Home Financials for this Owner
Home Financials are based on the most recent Mortgage that was taken out on this home.
Original Mortgage
$363,100
Outstanding Balance
$275,558
Interest Rate
4.45%
Mortgage Type
New Conventional
Estimated Equity
$688,720
Purchase Details
Closed on
Jul 5, 2011
Sold by
Phalin Jason James and Phalin Kimberly Jean
Bought by
Williams Erin E and Williams Garrett A
Home Financials for this Owner
Home Financials are based on the most recent Mortgage that was taken out on this home.
Original Mortgage
$372,803
Interest Rate
4.62%
Mortgage Type
FHA
Purchase Details
Closed on
Dec 24, 2008
Sold by
Olson Robert Edward
Bought by
Phalin Jason James and Phalin Kimberly Jean
Home Financials for this Owner
Home Financials are based on the most recent Mortgage that was taken out on this home.
Original Mortgage
$387,845
Interest Rate
5.6%
Mortgage Type
FHA
Purchase Details
Closed on
Dec 8, 1995
Sold by
Olson Enar F and Olson Louise K
Bought by
Olson Enar F and Olson Louise K
Create a Home Valuation Report for This Property
The Home Valuation Report is an in-depth analysis detailing your home's value as well as a comparison with similar homes in the area
Home Values in the Area
Average Home Value in this Area
Purchase History
| Date | Buyer | Sale Price | Title Company |
|---|---|---|---|
| Williams Garrett A | -- | None Available | |
| Williams Erin E | $382,500 | Chicago Title Company | |
| Phalin Jason James | $405,000 | Fidelity National Title | |
| Olson Enar F | -- | -- |
Source: Public Records
Mortgage History
| Date | Status | Borrower | Loan Amount |
|---|---|---|---|
| Open | Williams Garrett A | $363,100 | |
| Closed | Williams Erin E | $372,803 | |
| Previous Owner | Phalin Jason James | $387,845 |
Source: Public Records
Tax History Compared to Growth
Tax History
| Year | Tax Paid | Tax Assessment Tax Assessment Total Assessment is a certain percentage of the fair market value that is determined by local assessors to be the total taxable value of land and additions on the property. | Land | Improvement |
|---|---|---|---|---|
| 2025 | $6,346 | $524,174 | $351,689 | $172,485 |
| 2024 | $6,346 | $513,897 | $344,794 | $169,103 |
| 2023 | $6,206 | $503,822 | $338,034 | $165,788 |
| 2022 | $6,041 | $493,944 | $331,406 | $162,538 |
| 2021 | $6,000 | $484,259 | $324,908 | $159,351 |
| 2020 | $5,829 | $471,295 | $321,577 | $149,718 |
| 2019 | $5,339 | $430,682 | $315,272 | $115,410 |
| 2018 | $4,992 | $422,239 | $309,091 | $113,148 |
| 2017 | $4,874 | $413,961 | $303,031 | $110,930 |
| 2016 | $4,795 | $405,845 | $297,090 | $108,755 |
| 2015 | $4,725 | $399,750 | $292,628 | $107,122 |
| 2014 | $4,651 | $391,920 | $286,896 | $105,024 |
Source: Public Records
Map
Nearby Homes
- 5125 Fontaine St Unit 105
- 7137 Keighley St
- 4944 Old Cliffs Rd
- 4778 1/2 Old Cliffs Rd
- 4808 1/2 Old Cliffs Rd
- 4982 Old Cliffs Rd
- 6549 Glenroy St
- 4912.5 Old Cliffs Rd
- 6817 Birchwood St
- 6820 Newberry St
- 6818 Carthage St
- 5468 Princess View Place
- 6543 Carthage St
- 6642 Eldridge St
- 6994 Carthage St
- 6391 Estrella Ave
- 6725 Mission Gorge Rd Unit 104B
- 5564 Fontaine St
- 6675 Mission Gorge Rd Unit A114
- 6675 Mission Gorge Rd Unit B104