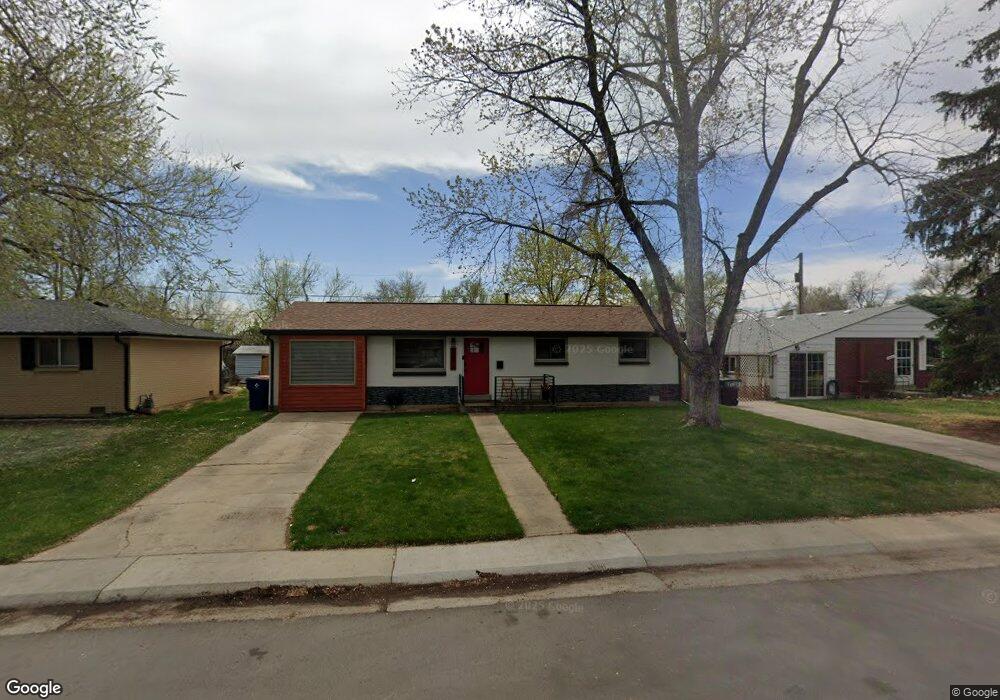
6872 W 53rd Place Arvada, CO 80002
Estimated Value: $549,000 - $565,000
3
Beds
2
Baths
1,333
Sq Ft
$417/Sq Ft
Est. Value
About This Home
This home is located at 6872 W 53rd Place, Arvada, CO 80002 and is currently estimated at $555,537, approximately $416 per square foot. 6872 W 53rd Place is a home located in Jefferson County with nearby schools including Secrest Elementary School, North Arvada Middle School, and Arvada High School.
Ownership History
Date
Name
Owned For
Owner Type
Purchase Details
Closed on
Jul 30, 2024
Sold by
Dewhirst Nathan
Bought by
Complete Ohana Mahalo Holdings Llc
Current Estimated Value
Purchase Details
Closed on
Dec 9, 2020
Sold by
Arrow Homes Llc
Bought by
Dewhrist Nathan
Home Financials for this Owner
Home Financials are based on the most recent Mortgage that was taken out on this home.
Original Mortgage
$297,500
Interest Rate
2.8%
Mortgage Type
New Conventional
Purchase Details
Closed on
Sep 30, 2020
Sold by
Jaryno Geraldine
Bought by
Arrow Homes Llc
Purchase Details
Closed on
Jun 12, 1997
Sold by
Dwayne Wilbanks Michael and Lorraine Kathleen
Bought by
Jaryno Geraldine M
Home Financials for this Owner
Home Financials are based on the most recent Mortgage that was taken out on this home.
Original Mortgage
$104,295
Interest Rate
7.98%
Mortgage Type
FHA
Create a Home Valuation Report for This Property
The Home Valuation Report is an in-depth analysis detailing your home's value as well as a comparison with similar homes in the area
Home Values in the Area
Average Home Value in this Area
Purchase History
| Date | Buyer | Sale Price | Title Company |
|---|---|---|---|
| Complete Ohana Mahalo Holdings Llc | -- | None Listed On Document | |
| Dewhrist Nathan | $425,000 | None Available | |
| Arrow Homes Llc | $199,500 | None Available | |
| Jaryno Geraldine M | $105,000 | Land Title |
Source: Public Records
Mortgage History
| Date | Status | Borrower | Loan Amount |
|---|---|---|---|
| Previous Owner | Dewhrist Nathan | $297,500 | |
| Previous Owner | Jaryno Geraldine M | $104,295 |
Source: Public Records
Tax History Compared to Growth
Tax History
| Year | Tax Paid | Tax Assessment Tax Assessment Total Assessment is a certain percentage of the fair market value that is determined by local assessors to be the total taxable value of land and additions on the property. | Land | Improvement |
|---|---|---|---|---|
| 2024 | $3,757 | $37,707 | $13,002 | $24,705 |
| 2023 | $3,757 | $37,707 | $13,002 | $24,705 |
| 2022 | $2,604 | $25,970 | $9,753 | $16,217 |
| 2021 | $2,643 | $26,717 | $10,034 | $16,683 |
| 2020 | $1,572 | $23,061 | $8,025 | $15,036 |
| 2019 | $1,551 | $23,061 | $8,025 | $15,036 |
| 2018 | $1,294 | $20,095 | $5,441 | $14,654 |
| 2017 | $1,848 | $20,095 | $5,441 | $14,654 |
| 2016 | $1,584 | $16,205 | $5,276 | $10,929 |
| 2015 | $1,341 | $16,205 | $5,276 | $10,929 |
| 2014 | $1,341 | $12,888 | $4,872 | $8,016 |
Source: Public Records
Map
Nearby Homes
- 6933 W 52nd Place
- 6801 W 52nd Ave
- 5465 Reed Ct
- 5465 Saulsbury Ct
- 5495 Saulsbury Ct
- 6700 W 55th Ave
- 6890 W 55th Place
- 5525 Pierce Ct
- 5513 Newland Way
- 6855 Reno Dr
- 6247 W 53rd Ave
- 7011 Grandview Ave
- 5320 Allison St Unit 106
- 5366 Allison St Unit C
- 7861 W 51st Ave Unit C
- 7861 W 51st Ave
- 5465 Zephyr St Unit 201
- 6902 Ralston Rd
- 4755 Reed St
- 6920 W 48th Ave Unit 6920
- 6862 W 53rd Place
- 6882 W 53rd Place
- 6869 W 53rd Ave
- 6859 W 53rd Ave
- 6879 W 53rd Ave
- 6852 W 53rd Place
- 6863 W 53rd Place
- 6877 W 53rd Place
- 6887 W 53rd Place
- 6849 W 53rd Ave
- 6867 W 53rd Place
- 6897 W 53rd Place
- 6914 W 53rd Place
- 6842 W 53rd Place
- 6857 W 53rd Place
- 5315 Quay Ct
- 5322 Reed St Unit Cozy 1 bedroom apartment
- 5322 Reed St
- 6917 W 53rd Place
- 6839 W 53rd Ave