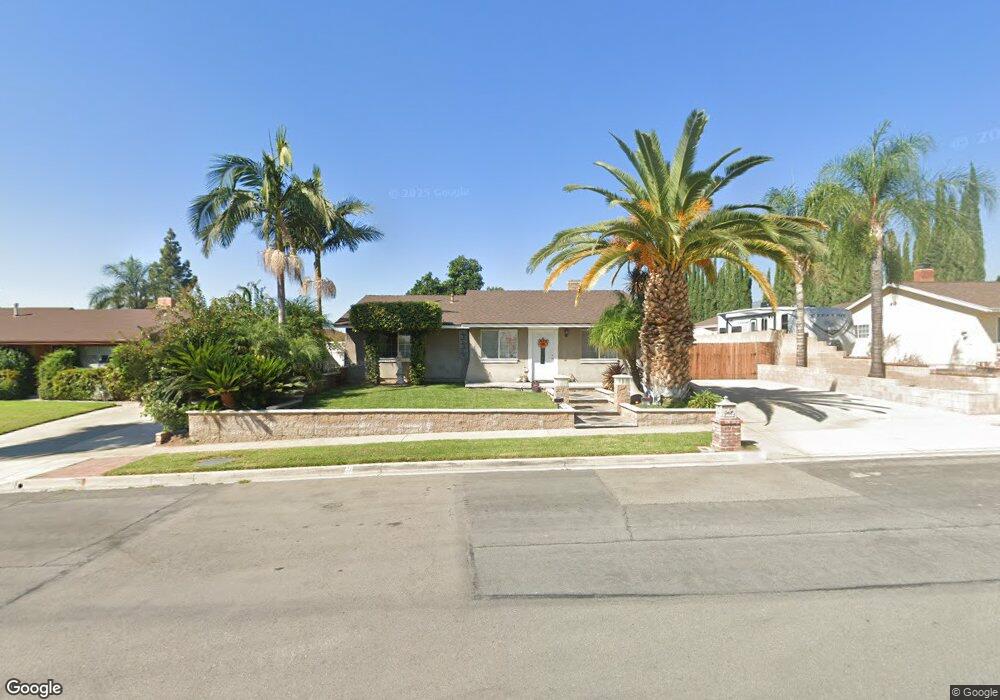
6874 Teak Way Rancho Cucamonga, CA 91701
Estimated Value: $664,771 - $775,000
3
Beds
2
Baths
1,212
Sq Ft
$598/Sq Ft
Est. Value
About This Home
This home is located at 6874 Teak Way, Rancho Cucamonga, CA 91701 and is currently estimated at $724,693, approximately $597 per square foot. 6874 Teak Way is a home located in San Bernardino County with nearby schools including Deer Canyon Elementary, Vineyard Junior High, and Los Osos High.
Ownership History
Date
Name
Owned For
Owner Type
Purchase Details
Closed on
Sep 6, 2019
Sold by
Fielding Russell Lee
Bought by
Fielding Russell Lee and The Russell Lee Fielding Livin
Current Estimated Value
Purchase Details
Closed on
Apr 1, 2009
Sold by
Fielding Victoria
Bought by
Fielding Russell Lee
Home Financials for this Owner
Home Financials are based on the most recent Mortgage that was taken out on this home.
Original Mortgage
$244,000
Interest Rate
4.8%
Mortgage Type
New Conventional
Purchase Details
Closed on
May 28, 1998
Sold by
Tolen Michael J
Bought by
Tolen Michael J
Home Financials for this Owner
Home Financials are based on the most recent Mortgage that was taken out on this home.
Original Mortgage
$75,000
Interest Rate
7.17%
Purchase Details
Closed on
Mar 15, 1995
Sold by
Tolen Michael J
Bought by
Tolen Michael J and The Michael J Tolen Trust
Create a Home Valuation Report for This Property
The Home Valuation Report is an in-depth analysis detailing your home's value as well as a comparison with similar homes in the area
Home Values in the Area
Average Home Value in this Area
Purchase History
| Date | Buyer | Sale Price | Title Company |
|---|---|---|---|
| Fielding Russell Lee | -- | None Available | |
| Fielding Russell Lee | -- | Nations Title Company Of Ca | |
| Tolen Michael J | -- | American Title | |
| Tolen Michael J | -- | World Title Company |
Source: Public Records
Mortgage History
| Date | Status | Borrower | Loan Amount |
|---|---|---|---|
| Closed | Fielding Russell Lee | $244,000 | |
| Closed | Tolen Michael J | $75,000 |
Source: Public Records
Tax History Compared to Growth
Tax History
| Year | Tax Paid | Tax Assessment Tax Assessment Total Assessment is a certain percentage of the fair market value that is determined by local assessors to be the total taxable value of land and additions on the property. | Land | Improvement |
|---|---|---|---|---|
| 2025 | $3,643 | $334,711 | $81,753 | $252,958 |
| 2024 | $3,643 | $328,148 | $80,150 | $247,998 |
| 2023 | $3,562 | $321,713 | $78,578 | $243,135 |
| 2022 | $3,553 | $315,405 | $77,037 | $238,368 |
| 2021 | $3,551 | $309,220 | $75,526 | $233,694 |
| 2020 | $3,406 | $306,050 | $74,752 | $231,298 |
| 2019 | $3,445 | $300,049 | $73,286 | $226,763 |
| 2018 | $3,368 | $294,166 | $71,849 | $222,317 |
| 2017 | $3,215 | $288,398 | $70,440 | $217,958 |
| 2016 | $3,128 | $282,743 | $69,059 | $213,684 |
| 2015 | $3,108 | $278,496 | $68,022 | $210,474 |
| 2014 | $3,021 | $273,041 | $66,690 | $206,351 |
Source: Public Records
Map
Nearby Homes
- 10040 Jonquil Dr
- 6949 Laguna Place Unit B1
- 6740 London Ave
- 7018 Princeton Place
- 9740 Woodleaf Dr
- 6644 Brissac Place
- 6600 Montresor Place
- 6765 Jadeite Ave
- 6946 Archibald Ave
- 10123 Finch Ave
- 9800 Baseline Rd Unit 76
- 9800 Baseline Rd Unit 71
- 9800 Baseline Rd Unit 17
- 9800 Baseline Rd Unit 82
- 9800 Baseline Rd Unit 62
- 6880 Archibald Ave Unit 27
- 6880 Archibald Ave Unit 40
- 6880 Archibald Ave Unit 43
- 10210 Baseline Rd Unit 30
- 10210 Baseline Rd Unit 62
- 6864 Teak Way
- 6884 Teak Way
- 6875 Berkshire Ave
- 6881 Berkshire Ave
- 6894 Teak Way
- 10008 Goldenrod Ct
- 9987 Holly St
- 9977 Holly St
- 10005 Goldenrod Ct
- 6871 Berkshire Ave
- 9967 Holly St
- 10018 Goldenrod Ct
- 9960 Victoria St
- 10015 Goldenrod Ct
- 9959 Holly St
- 6849 Teak Way
- 10028 Goldenrod Ct
- 6869 Berkshire Ave
- 10025 Goldenrod Ct
- 9987 Victoria St