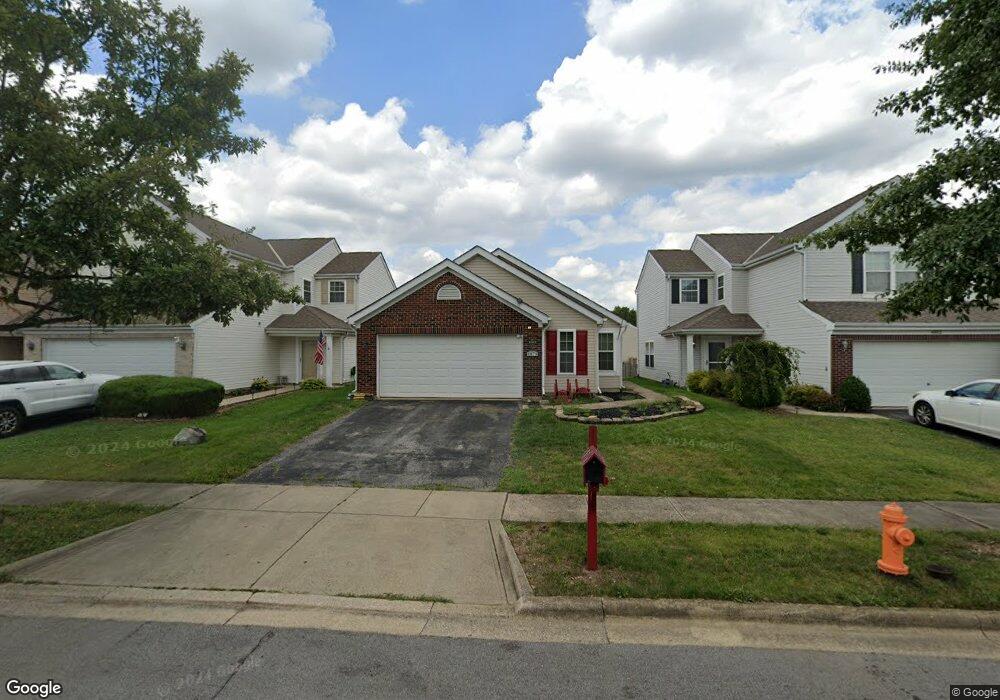
6876 Manor Crest Ln Canal Winchester, OH 43110
Abbie Trails NeighborhoodEstimated Value: $268,618 - $276,000
3
Beds
2
Baths
1,253
Sq Ft
$217/Sq Ft
Est. Value
About This Home
This home is located at 6876 Manor Crest Ln, Canal Winchester, OH 43110 and is currently estimated at $271,655, approximately $216 per square foot. 6876 Manor Crest Ln is a home located in Franklin County with nearby schools including Groveport Madison High School, A+ Arts Academy, and Brice Christian Academy Elementary School.
Ownership History
Date
Name
Owned For
Owner Type
Purchase Details
Closed on
Apr 3, 2009
Sold by
Harris Angela and Harris John
Bought by
Perdue Delbert J and Perdue Deborah
Current Estimated Value
Home Financials for this Owner
Home Financials are based on the most recent Mortgage that was taken out on this home.
Original Mortgage
$123,717
Outstanding Balance
$78,920
Interest Rate
5.11%
Mortgage Type
FHA
Estimated Equity
$192,735
Purchase Details
Closed on
Sep 25, 2007
Sold by
U S Bank Na
Bought by
Harris Angela
Purchase Details
Closed on
May 2, 2007
Sold by
Moore George M and Moore George M
Bought by
Us Bank Na and Securirity Corp Home Equity Loan Trust S
Purchase Details
Closed on
Sep 23, 2005
Sold by
M/I Homes Of Central Ohio Llc
Bought by
Moore George M
Home Financials for this Owner
Home Financials are based on the most recent Mortgage that was taken out on this home.
Original Mortgage
$112,700
Interest Rate
7.89%
Mortgage Type
Fannie Mae Freddie Mac
Create a Home Valuation Report for This Property
The Home Valuation Report is an in-depth analysis detailing your home's value as well as a comparison with similar homes in the area
Home Values in the Area
Average Home Value in this Area
Purchase History
| Date | Buyer | Sale Price | Title Company |
|---|---|---|---|
| Perdue Delbert J | $126,000 | Amerititle | |
| Harris Angela | $106,000 | None Available | |
| Us Bank Na | $92,000 | None Available | |
| Moore George M | $140,900 | Priority L |
Source: Public Records
Mortgage History
| Date | Status | Borrower | Loan Amount |
|---|---|---|---|
| Open | Perdue Delbert J | $123,717 | |
| Previous Owner | Moore George M | $112,700 |
Source: Public Records
Tax History Compared to Growth
Tax History
| Year | Tax Paid | Tax Assessment Tax Assessment Total Assessment is a certain percentage of the fair market value that is determined by local assessors to be the total taxable value of land and additions on the property. | Land | Improvement |
|---|---|---|---|---|
| 2024 | $3,178 | $74,940 | $25,730 | $49,210 |
| 2023 | $3,337 | $74,935 | $25,725 | $49,210 |
| 2022 | $2,421 | $46,490 | $8,860 | $37,630 |
| 2021 | $2,545 | $46,490 | $8,860 | $37,630 |
| 2020 | $2,358 | $46,490 | $8,860 | $37,630 |
| 2019 | $2,320 | $40,920 | $7,700 | $33,220 |
| 2018 | $2,279 | $40,920 | $7,700 | $33,220 |
| 2017 | $2,271 | $40,920 | $7,700 | $33,220 |
| 2016 | $2,199 | $35,110 | $8,230 | $26,880 |
| 2015 | $2,223 | $35,110 | $8,230 | $26,880 |
| 2014 | $2,248 | $35,110 | $8,230 | $26,880 |
| 2013 | $990 | $36,925 | $8,645 | $28,280 |
Source: Public Records
Map
Nearby Homes
- 6865 Manor Crest Ln
- 4028 Boyer Ridge Dr
- 7260 Long Rd
- 6747 Dorothys Crossing Unit 6747
- 7490 Sugarbark Ct
- 3682 Winding Path Dr
- 6523 Dorothys Creek
- 3624 Peany Ln
- 6800 Barker Dr
- 3345 Trentshire Dr
- 3265 O'Heagra Dr
- 6400 Old Ben Ln
- 3535 Wheatfield Dr
- 7287 Candlestone Dr
- 165 Norland Dr
- 106 Portrait Cir
- 0 Refugee Rd
- 3292 Draycott Ct
- 540 Fullers Cir Unit 103
- 6286 Stoney Glenn Ct
- 6882 Manor Crest Ln
- 6870 Manor Crest Ln
- 6888 Manor Crest Ln
- 6864 Manor Crest Ln
- 6875 Tumbleweed Ln
- 6894 Manor Crest Ln
- 6881 Tumbleweed Ln
- 6858 Manor Crest Ln
- 6869 Tumbleweed Ln
- 6887 Tumbleweed Ln
- 6863 Tumbleweed Ln
- 6900 Manor Crest Ln
- 6852 Manor Crest Ln
- 6893 Tumbleweed Ln
- 6883 Manor Crest Ln
- 6877 Manor Crest Ln
- 6857 Tumbleweed Ln
- 6889 Manor Crest Ln
- 6895 Manor Crest Ln
- 6899 Tumbleweed Ln