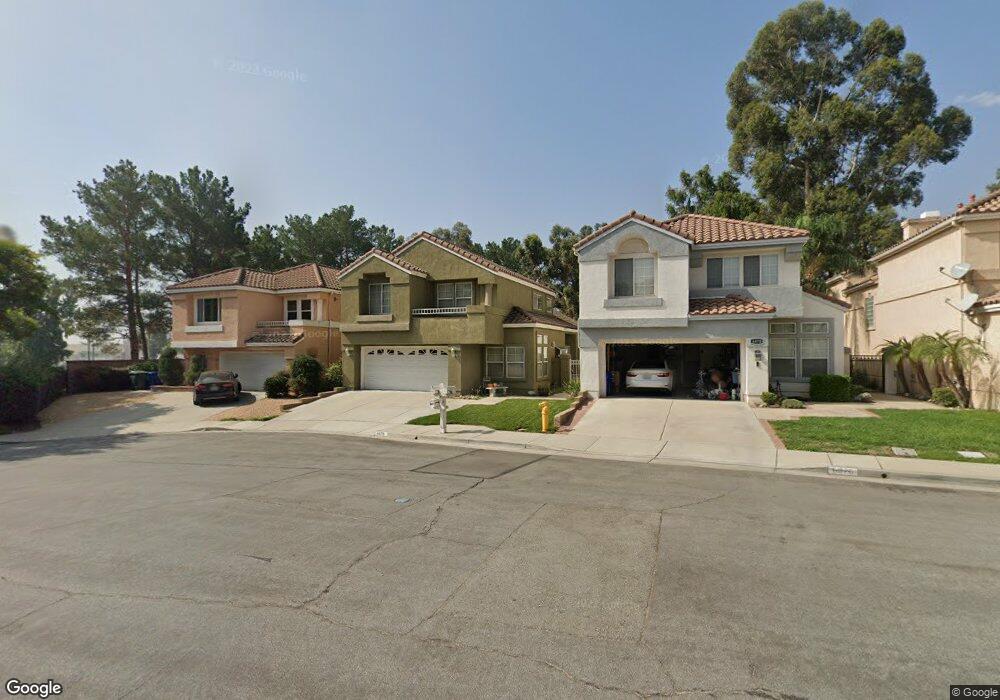
6878 Bergano Place Rancho Cucamonga, CA 91701
Victoria NeighborhoodEstimated Value: $819,445 - $909,000
3
Beds
3
Baths
2,036
Sq Ft
$421/Sq Ft
Est. Value
About This Home
This home is located at 6878 Bergano Place, Rancho Cucamonga, CA 91701 and is currently estimated at $857,111, approximately $420 per square foot. 6878 Bergano Place is a home located in San Bernardino County with nearby schools including Carleton P. Lightfoot Elementary, Day Creek Intermediate, and Rancho Cucamonga High School.
Ownership History
Date
Name
Owned For
Owner Type
Purchase Details
Closed on
May 26, 2020
Sold by
Martinez Rachel
Bought by
Martinez Rachel and Miranda Joseph
Current Estimated Value
Purchase Details
Closed on
Mar 11, 2009
Sold by
Martinez Rachel
Bought by
Martinez Rachel
Home Financials for this Owner
Home Financials are based on the most recent Mortgage that was taken out on this home.
Original Mortgage
$245,000
Outstanding Balance
$154,959
Interest Rate
5.03%
Mortgage Type
New Conventional
Estimated Equity
$702,152
Purchase Details
Closed on
May 16, 2001
Sold by
Moore Autie Phyllis
Bought by
Martinez Rachel and Miranda Joseph
Home Financials for this Owner
Home Financials are based on the most recent Mortgage that was taken out on this home.
Original Mortgage
$220,300
Interest Rate
7.14%
Create a Home Valuation Report for This Property
The Home Valuation Report is an in-depth analysis detailing your home's value as well as a comparison with similar homes in the area
Home Values in the Area
Average Home Value in this Area
Purchase History
| Date | Buyer | Sale Price | Title Company |
|---|---|---|---|
| Martinez Rachel | -- | None Available | |
| Martinez Rachel | -- | Nations Title Company Of Cal | |
| Martinez Rachel | $232,000 | First American Title |
Source: Public Records
Mortgage History
| Date | Status | Borrower | Loan Amount |
|---|---|---|---|
| Open | Martinez Rachel | $245,000 | |
| Closed | Martinez Rachel | $220,300 |
Source: Public Records
Tax History Compared to Growth
Tax History
| Year | Tax Paid | Tax Assessment Tax Assessment Total Assessment is a certain percentage of the fair market value that is determined by local assessors to be the total taxable value of land and additions on the property. | Land | Improvement |
|---|---|---|---|---|
| 2025 | $4,517 | $357,979 | $87,361 | $270,618 |
| 2024 | $4,517 | $350,960 | $85,648 | $265,312 |
| 2023 | $4,391 | $344,079 | $83,969 | $260,110 |
| 2022 | $4,315 | $337,333 | $82,323 | $255,010 |
| 2021 | $4,237 | $330,719 | $80,709 | $250,010 |
| 2020 | $4,265 | $327,327 | $79,881 | $247,446 |
| 2019 | $4,165 | $320,909 | $78,315 | $242,594 |
| 2018 | $4,157 | $314,616 | $76,779 | $237,837 |
| 2017 | $3,981 | $308,448 | $75,274 | $233,174 |
| 2016 | $3,874 | $302,400 | $73,798 | $228,602 |
| 2015 | $3,840 | $297,857 | $72,689 | $225,168 |
| 2014 | $3,748 | $292,022 | $71,265 | $220,757 |
Source: Public Records
Map
Nearby Homes
- 6999 Canosa Place
- 6701 Marsala Place
- 6670 Meadowlane Place
- 7116 Sapri Place
- 7070 Pozallo Place
- 11855 Modena Dr
- 7139 Scalea Place
- 6988 Edinburgh Place
- 11266 Gannon St
- 7235 Venosa Place
- 7271 Venosa Place
- 6530 Catania Place
- 6792 Galveston Place
- 7343 Legacy Place
- 6886 Cabrini Ct
- 7358 Freedom Place
- 11571 Pinnacle Peak Ct
- 11959 Huntley Dr
- 6419 Panorama Ct
- 11839 Antler Peak Ct
- 6870 Bergano Place
- 6886 Bergano Place
- 6862 Bergano Place
- 6854 Bergano Place
- 6919 Landriano Place
- 6846 Bergano Place
- 6927 Landriano Place
- 6911 Landriano Place
- 6877 Bergano Place
- 6869 Bergano Place
- 6885 Bergano Place
- 6861 Bergano Place
- 6838 Bergano Place
- 6903 Landriano Place
- 6853 Bergano Place
- 6830 Bergano Place
- 6845 Bergano Place
- 6895 Landriano Place
- 6837 Bergano Place
- 6874 Portofino Ct