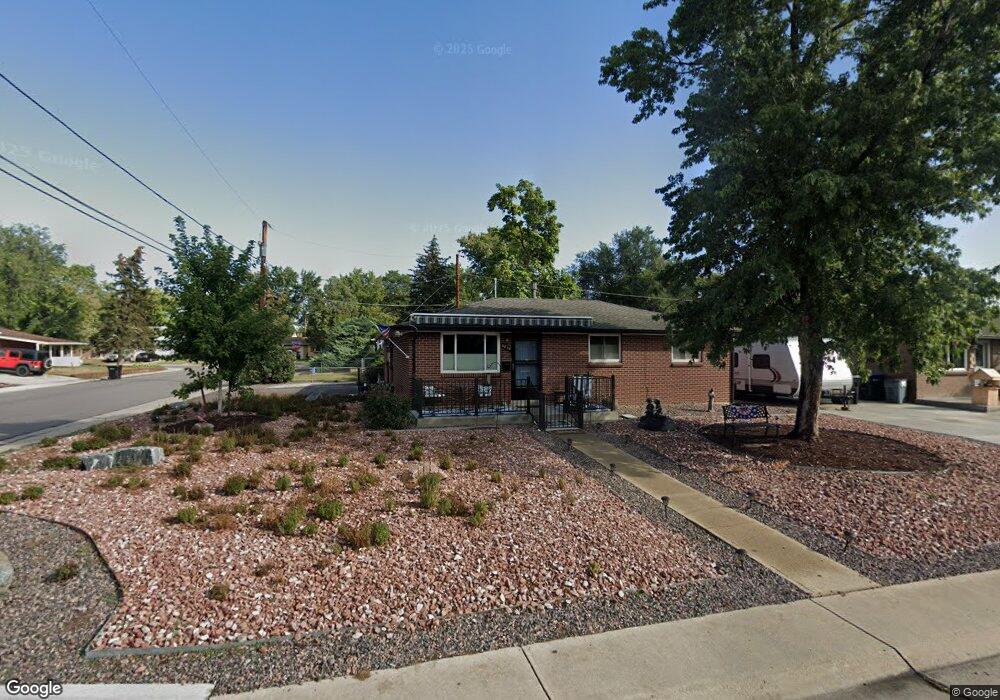
6879 W 53rd Ave Arvada, CO 80002
Estimated Value: $436,000 - $488,590
3
Beds
1
Bath
1,217
Sq Ft
$376/Sq Ft
Est. Value
About This Home
This home is located at 6879 W 53rd Ave, Arvada, CO 80002 and is currently estimated at $457,148, approximately $375 per square foot. 6879 W 53rd Ave is a home located in Jefferson County with nearby schools including Secrest Elementary School, North Arvada Middle School, and Arvada High School.
Ownership History
Date
Name
Owned For
Owner Type
Purchase Details
Closed on
Mar 19, 2021
Sold by
Meixner Bruce J and Meixner Deborah K
Bought by
Irby Denise
Current Estimated Value
Home Financials for this Owner
Home Financials are based on the most recent Mortgage that was taken out on this home.
Original Mortgage
$286,000
Outstanding Balance
$256,811
Interest Rate
2.8%
Mortgage Type
New Conventional
Estimated Equity
$200,337
Purchase Details
Closed on
May 28, 1999
Sold by
Roush Carol M
Bought by
Chismar Wayne P
Home Financials for this Owner
Home Financials are based on the most recent Mortgage that was taken out on this home.
Original Mortgage
$107,600
Interest Rate
6.91%
Purchase Details
Closed on
Jul 7, 1995
Sold by
Bennetts Lois A
Bought by
Roush Carol M
Home Financials for this Owner
Home Financials are based on the most recent Mortgage that was taken out on this home.
Original Mortgage
$93,712
Interest Rate
7.65%
Mortgage Type
FHA
Create a Home Valuation Report for This Property
The Home Valuation Report is an in-depth analysis detailing your home's value as well as a comparison with similar homes in the area
Purchase History
| Date | Buyer | Sale Price | Title Company |
|---|---|---|---|
| Irby Denise | $367,500 | None Available | |
| Chismar Wayne P | $134,500 | Land Title | |
| Roush Carol M | $94,350 | Land Title |
Source: Public Records
Mortgage History
| Date | Status | Borrower | Loan Amount |
|---|---|---|---|
| Open | Irby Denise | $286,000 | |
| Previous Owner | Chismar Wayne P | $107,600 | |
| Previous Owner | Roush Carol M | $93,712 |
Source: Public Records
Tax History
| Year | Tax Paid | Tax Assessment Tax Assessment Total Assessment is a certain percentage of the fair market value that is determined by local assessors to be the total taxable value of land and additions on the property. | Land | Improvement |
|---|---|---|---|---|
| 2024 | $3,056 | $30,673 | $13,312 | $17,361 |
| 2023 | $3,056 | $30,673 | $13,312 | $17,361 |
| 2022 | $2,575 | $25,683 | $9,911 | $15,772 |
| 2021 | $2,613 | $26,422 | $10,196 | $16,226 |
| 2020 | $2,271 | $22,984 | $8,445 | $14,539 |
| 2019 | $2,240 | $22,984 | $8,445 | $14,539 |
| 2018 | $1,958 | $19,520 | $6,012 | $13,508 |
| 2017 | $1,795 | $19,520 | $6,012 | $13,508 |
| 2016 | $1,527 | $15,616 | $5,276 | $10,340 |
| 2015 | $1,294 | $15,616 | $5,276 | $10,340 |
| 2014 | $1,294 | $12,434 | $4,872 | $7,562 |
Source: Public Records
Map
Nearby Homes
- 5423 Saulsbury Ct
- 5465 Reed Ct
- 6940 W 55th Place
- 6865 W 55th Place
- 7357 Grandview Ave Unit 202
- 5716 Saulsbury St
- 7856 W 54th Ave Unit 7856
- 5320 Allison St Unit 106
- 6902 Ralston Rd
- 5366 Allison St Unit D
- 7221 W 48th Ave
- 6427 Grandview Ave Unit A & B
- 5409 Zephyr Ct Unit 5409
- 7931 W 55th Ave Unit 112
- 6500 Ralston Rd Unit A
- 5460 Allison St Unit 102
- 8028 W 52nd Ln Unit B
- 5419 Allison St Unit G
- 5419 Allison St Unit F
- 6920 W 48th Ave Unit 6920
- 6869 W 53rd Ave
- 6882 W 53rd Place
- 6872 W 53rd Place
- 6859 W 53rd Ave
- 5315 Quay Ct
- 5322 Reed St Unit Cozy 1 bedroom apart
- 5322 Reed St
- 6914 W 53rd Place
- 6874 W 53rd Ave
- 6864 W 53rd Ave
- 5305 Quay Ct
- 6862 W 53rd Place
- 6849 W 53rd Ave
- 6854 W 53rd Ave
- 5265 Quay Ct
- 6934 W 53rd Place
- 6852 W 53rd Place
- 6844 W 53rd Ave
- 5255 Quay Ct
- 6954 W 53rd Place
Your Personal Tour Guide
Ask me questions while you tour the home.