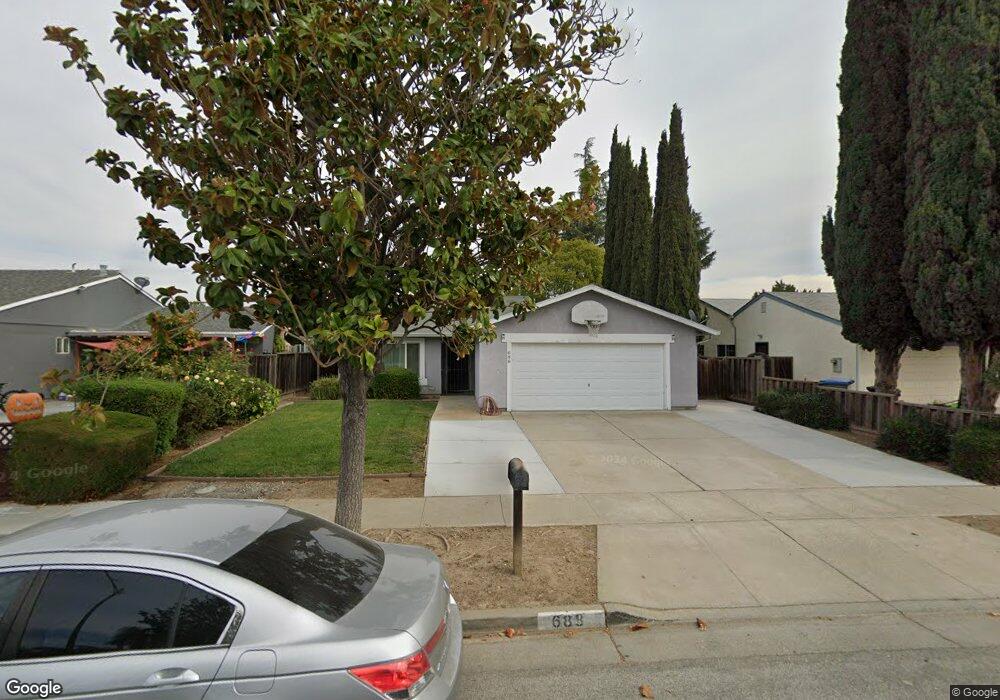
688 Lava Way San Jose, CA 95133
Commodore NeighborhoodEstimated Value: $1,023,000 - $1,133,000
3
Beds
2
Baths
1,152
Sq Ft
$927/Sq Ft
Est. Value
About This Home
This home is located at 688 Lava Way, San Jose, CA 95133 and is currently estimated at $1,067,731, approximately $926 per square foot. 688 Lava Way is a home located in Santa Clara County with nearby schools including Summerdale Elementary School, Piedmont Middle School, and Independence High School.
Ownership History
Date
Name
Owned For
Owner Type
Purchase Details
Closed on
Jun 30, 2023
Sold by
Copas Mac and Copas Gloria A
Bought by
Mac And Gloria Copas Living Trust and Copas
Current Estimated Value
Purchase Details
Closed on
May 12, 2004
Sold by
Copas Melciades and Copas Gloria A
Bought by
Copas Mac and Copas Gloria A
Home Financials for this Owner
Home Financials are based on the most recent Mortgage that was taken out on this home.
Original Mortgage
$292,500
Interest Rate
5.6%
Mortgage Type
New Conventional
Create a Home Valuation Report for This Property
The Home Valuation Report is an in-depth analysis detailing your home's value as well as a comparison with similar homes in the area
Home Values in the Area
Average Home Value in this Area
Purchase History
| Date | Buyer | Sale Price | Title Company |
|---|---|---|---|
| Mac And Gloria Copas Living Trust | -- | None Listed On Document | |
| Copas Mac | -- | Chicago Title Pirt Dept |
Source: Public Records
Mortgage History
| Date | Status | Borrower | Loan Amount |
|---|---|---|---|
| Previous Owner | Copas Mac | $292,500 |
Source: Public Records
Tax History
| Year | Tax Paid | Tax Assessment Tax Assessment Total Assessment is a certain percentage of the fair market value that is determined by local assessors to be the total taxable value of land and additions on the property. | Land | Improvement |
|---|---|---|---|---|
| 2025 | $2,546 | $90,274 | $27,690 | $62,584 |
| 2024 | $2,546 | $88,505 | $27,148 | $61,357 |
| 2023 | $2,454 | $86,770 | $26,616 | $60,154 |
| 2022 | $2,429 | $85,070 | $26,095 | $58,975 |
| 2021 | $2,305 | $83,403 | $25,584 | $57,819 |
| 2020 | $2,196 | $82,549 | $25,322 | $57,227 |
| 2019 | $2,102 | $80,931 | $24,826 | $56,105 |
| 2018 | $2,051 | $79,345 | $24,340 | $55,005 |
| 2017 | $2,032 | $77,790 | $23,863 | $53,927 |
| 2016 | $2,017 | $76,266 | $23,396 | $52,870 |
| 2015 | $1,981 | $75,121 | $23,045 | $52,076 |
| 2014 | $1,537 | $73,650 | $22,594 | $51,056 |
Source: Public Records
Map
Nearby Homes
- 2344 Pacheco Dr
- 661 Devlin Ct
- 2547 Easton Ln Unit 18
- 2420 Kita Ln
- 2580 Gimelli Way
- 636 Messina Gardens Ln
- 604 Apricot Way
- 2599 Easton Ln Unit 108
- 706 Fruit Ranch Loop
- 12280 Mabury Rd
- 839 Cane Palm Ct
- 651 N Capitol Ave
- 714 N Capitol Ave
- 445 N Capitol Ave Unit 430
- 879 Wyman Way Unit 2
- 2505 Golzio Ct Unit 1
- 2598 Mabury Square
- 2505 Dillion Ct Unit 3
- 982 Cadet Place
- 1986 Galileo Ln
Your Personal Tour Guide
Ask me questions while you tour the home.