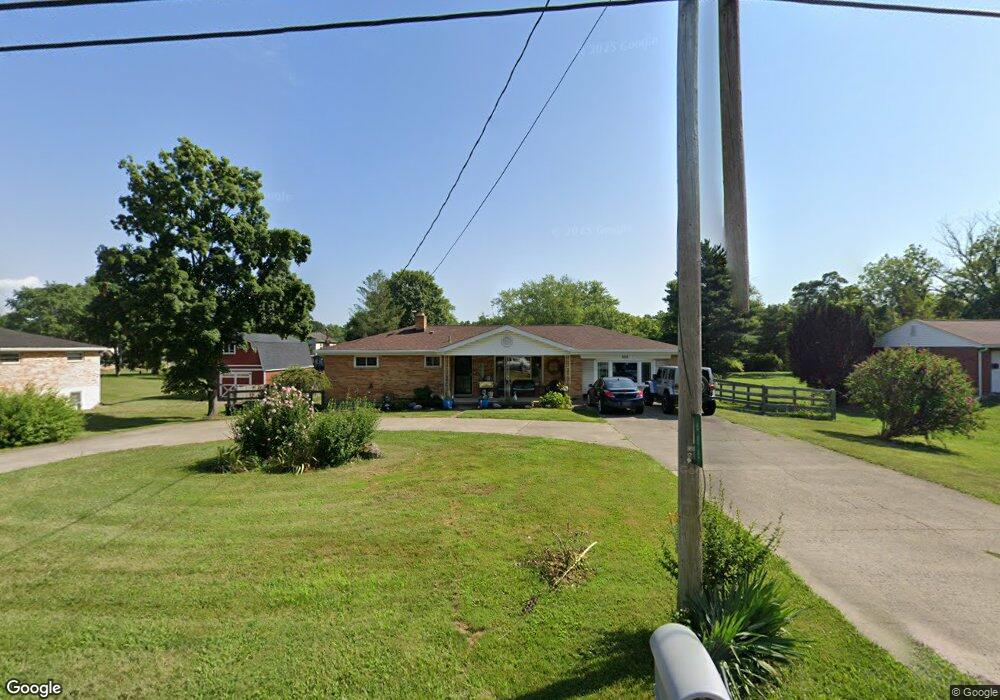
688 W Foster Maineville Rd Maineville, OH 45039
Hamilton Township NeighborhoodEstimated Value: $384,075 - $443,000
5
Beds
3
Baths
1,932
Sq Ft
$211/Sq Ft
Est. Value
About This Home
This home is located at 688 W Foster Maineville Rd, Maineville, OH 45039 and is currently estimated at $407,769, approximately $211 per square foot. 688 W Foster Maineville Rd is a home located in Warren County with nearby schools including Little Miami Early Childhood Center, Little Miami Intermediate Middle School, and Little Miami Middle School.
Ownership History
Date
Name
Owned For
Owner Type
Purchase Details
Closed on
Aug 9, 2012
Sold by
Norton Letcher B and Norton Linda K
Bought by
Helton Darrell C
Current Estimated Value
Home Financials for this Owner
Home Financials are based on the most recent Mortgage that was taken out on this home.
Original Mortgage
$145,600
Outstanding Balance
$97,632
Interest Rate
3%
Mortgage Type
Adjustable Rate Mortgage/ARM
Estimated Equity
$310,137
Purchase Details
Closed on
Mar 6, 1997
Sold by
Redding Don
Bought by
Norton Letcher B and Norton Linda K
Home Financials for this Owner
Home Financials are based on the most recent Mortgage that was taken out on this home.
Original Mortgage
$109,250
Interest Rate
7.93%
Mortgage Type
New Conventional
Purchase Details
Closed on
Dec 21, 1992
Sold by
Redding L.B. and Redding Verna L.
Bought by
Redding and Redding Don
Create a Home Valuation Report for This Property
The Home Valuation Report is an in-depth analysis detailing your home's value as well as a comparison with similar homes in the area
Home Values in the Area
Average Home Value in this Area
Purchase History
| Date | Buyer | Sale Price | Title Company |
|---|---|---|---|
| Helton Darrell C | $182,000 | Arrow Title Agency Llc | |
| Norton Letcher B | $115,000 | -- | |
| Redding | -- | -- |
Source: Public Records
Mortgage History
| Date | Status | Borrower | Loan Amount |
|---|---|---|---|
| Open | Helton Darrell C | $145,600 | |
| Previous Owner | Norton Letcher B | $109,250 |
Source: Public Records
Tax History Compared to Growth
Tax History
| Year | Tax Paid | Tax Assessment Tax Assessment Total Assessment is a certain percentage of the fair market value that is determined by local assessors to be the total taxable value of land and additions on the property. | Land | Improvement |
|---|---|---|---|---|
| 2024 | $4,583 | $103,160 | $24,560 | $78,600 |
| 2023 | $4,221 | $84,812 | $15,102 | $69,709 |
| 2022 | $4,173 | $84,812 | $15,103 | $69,710 |
| 2021 | $3,978 | $84,812 | $15,103 | $69,710 |
| 2020 | $3,788 | $68,954 | $12,278 | $56,676 |
| 2019 | $3,852 | $68,954 | $12,278 | $56,676 |
| 2018 | $3,774 | $68,954 | $12,278 | $56,676 |
| 2017 | $3,122 | $57,327 | $11,291 | $46,036 |
| 2016 | $3,198 | $57,327 | $11,291 | $46,036 |
| 2015 | $3,196 | $57,327 | $11,291 | $46,036 |
| 2014 | $3,290 | $52,120 | $10,270 | $41,850 |
| 2013 | $3,226 | $62,340 | $12,280 | $50,060 |
Source: Public Records
Map
Nearby Homes
- 7903 Hopkins Rd
- 373 W Fosters Maineville Rd
- 8128 Sycamore St
- 8404 Gettysburg Ln
- 1152 Chaucer Place
- 8339 Maineville Rd
- 7860 Ravenwood Ln
- 84 W Foster Maineville Rd
- 149 Hildebrant Dr
- 0 S St Rt 48 Unit 1858823
- 8408 Sibcy Rd
- 1081 Sedgefield Ct
- 7499 Stephen St
- 8573 Maineville Rd
- 8371 Ohio 48
- 1114 Marion Ave
- 763 Bamburgh Dr
- 8371 S State Route 48
- Lot French Ct
- 1 Lot French Ct
- 712 W Foster Maineville Rd
- 668 W Foster Maineville Rd
- 8042 Laurelwood Dr
- 8128 Cheltenham Ct Unit 179
- 8069 Laurelwood Dr
- 8138 Cheltenham Ct
- 8022 Laurelwood Dr
- 8129 Cheltenham Ct
- 661 Majestic Ct
- 637 W Foster Maineville Rd
- 616 W Fosters Maineville Rd
- 616 W Foster Maineville Rd
- 762 W Fosters Maineville Rd
- 8008 Laurelwood Dr
- 8154 Cheltenham Ct
- 619 W Foster Maineville Rd
- 8139 Cheltenham Ct
- 681 Majestic Ct
- 778 W Foster Maineville Rd
- 660 Majestic Ct