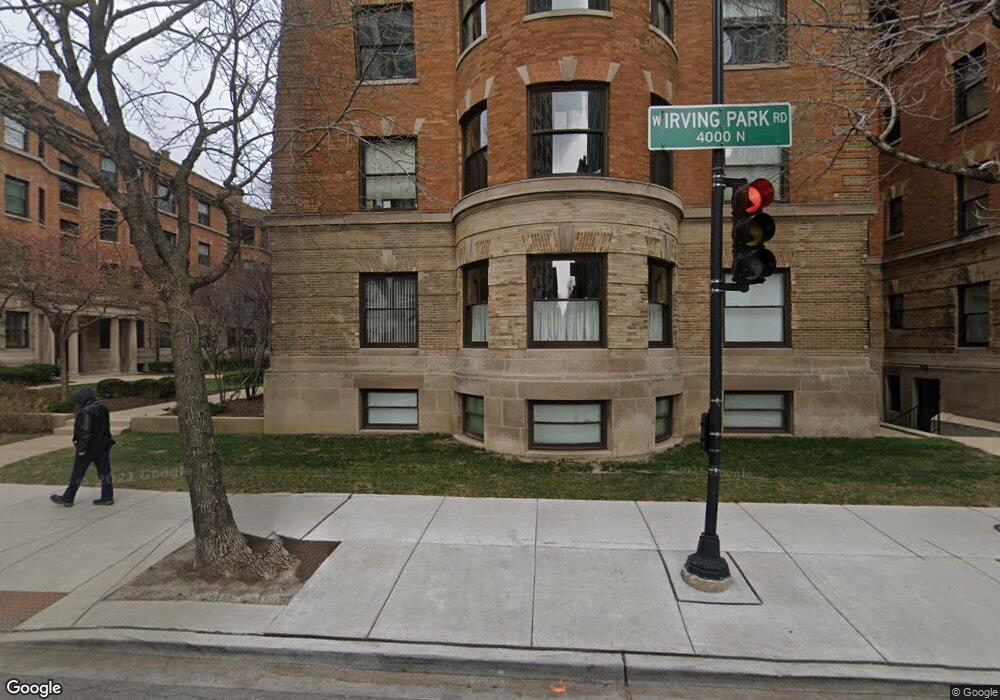
688 W Irving Park Rd Unit D6 Chicago, IL 60613
Buena Park NeighborhoodEstimated Value: $286,000 - $426,000
--
Bed
--
Bath
--
Sq Ft
2.92
Acres
About This Home
This home is located at 688 W Irving Park Rd Unit D6, Chicago, IL 60613 and is currently estimated at $349,649. 688 W Irving Park Rd Unit D6 is a home located in Cook County with nearby schools including Brennemann Elementary School, Senn High School, and Bernard Zell Anshe Emet Day School.
Ownership History
Date
Name
Owned For
Owner Type
Purchase Details
Closed on
Nov 13, 2024
Sold by
Yanow Geri Lynn
Bought by
Geri Lynn Yanow Trust and Yanow
Current Estimated Value
Home Financials for this Owner
Home Financials are based on the most recent Mortgage that was taken out on this home.
Original Mortgage
$72,500
Interest Rate
9.25%
Mortgage Type
New Conventional
Purchase Details
Closed on
Aug 6, 2024
Sold by
Yanow Geri Lynn
Bought by
Geri Lynn Yanow Trust and Yanow
Purchase Details
Closed on
Dec 29, 1993
Sold by
Larsen Michael and Larsen Anne
Bought by
Yanow Geri Lynn
Home Financials for this Owner
Home Financials are based on the most recent Mortgage that was taken out on this home.
Original Mortgage
$113,400
Interest Rate
7.16%
Create a Home Valuation Report for This Property
The Home Valuation Report is an in-depth analysis detailing your home's value as well as a comparison with similar homes in the area
Home Values in the Area
Average Home Value in this Area
Purchase History
| Date | Buyer | Sale Price | Title Company |
|---|---|---|---|
| Geri Lynn Yanow Trust | -- | Indecomm Global Services | |
| Yanow Geri Lynn | -- | Indecomm Global Services | |
| Geri Lynn Yanow Trust | -- | None Listed On Document | |
| Yanow Geri Lynn | $84,000 | -- |
Source: Public Records
Mortgage History
| Date | Status | Borrower | Loan Amount |
|---|---|---|---|
| Previous Owner | Yanow Geri Lynn | $72,500 | |
| Previous Owner | Yanow Geri Lynn | $113,400 |
Source: Public Records
Tax History Compared to Growth
Tax History
| Year | Tax Paid | Tax Assessment Tax Assessment Total Assessment is a certain percentage of the fair market value that is determined by local assessors to be the total taxable value of land and additions on the property. | Land | Improvement |
|---|---|---|---|---|
| 2024 | $3,383 | $33,093 | $11,670 | $21,423 |
| 2023 | $3,258 | $22,000 | $10,432 | $11,568 |
| 2022 | $3,258 | $22,000 | $10,432 | $11,568 |
| 2021 | $3,218 | $21,999 | $10,431 | $11,568 |
| 2020 | $3,444 | $21,043 | $6,519 | $14,524 |
| 2019 | $3,419 | $23,192 | $6,519 | $16,673 |
| 2018 | $3,360 | $23,192 | $6,519 | $16,673 |
| 2017 | $3,452 | $22,113 | $5,737 | $16,376 |
| 2016 | $3,572 | $22,113 | $5,737 | $16,376 |
| 2015 | $3,228 | $22,113 | $5,737 | $16,376 |
| 2014 | $3,096 | $21,091 | $4,433 | $16,658 |
| 2013 | $3,016 | $21,091 | $4,433 | $16,658 |
Source: Public Records
Map
Nearby Homes
- 707 W Bittersweet Place Unit K2
- 645 W Bittersweet Place Unit 1
- 708 W Bittersweet Place Unit 111
- 700 W Bittersweet Place Unit 904
- 700 W Bittersweet Place Unit 308
- 700 W Bittersweet Place Unit 1004
- 3930 N Pine Grove Ave Unit 1002
- 3930 N Pine Grove Ave Unit 1606
- 3930 N Pine Grove Ave Unit 607
- 3930 N Pine Grove Ave Unit 2313
- 3930 N Pine Grove Ave Unit 2205
- 3930 N Pine Grove Ave Unit 604
- 3930 N Pine Grove Ave Unit 2010
- 3930 N Pine Grove Ave Unit 3009
- 4046 N Clarendon Ave Unit 1S
- 4004 N Clarendon Ave Unit 3
- 4004 N Clarendon Ave Unit 1
- 655 W Irving Park Rd Unit 1911
- 655 W Irving Park Rd Unit 1301
- 655 W Irving Park Rd Unit B-54
- 688 W Irving Park Rd Unit D7
- 688 W Irving Park Rd Unit D8
- 688 W Irving Park Rd Unit D5
- 690 W Irving Park Rd Unit D2
- 690 W Irving Park Rd Unit D4
- 690 W Irving Park Rd Unit D3
- 690 W Irving Park Rd Unit D1
- 684 W Irving Park Rd Unit E8
- 684 W Irving Park Rd Unit E7
- 684 W Irving Park Rd Unit E6
- 684 W Irving Park Rd Unit E5
- 700 W Irving Park Rd Unit 1A
- 700 W Irving Park Rd Unit A1
- 700 W Irving Park Rd Unit A3
- 700 W Irving Park Rd Unit A4
- 692 W Irving Park Rd Unit C4
- 692 W Irving Park Rd Unit C3
- 692 W Irving Park Rd Unit C2
- 686 W Irving Park Rd Unit 2E
- 686 W Irving Park Rd Unit E2