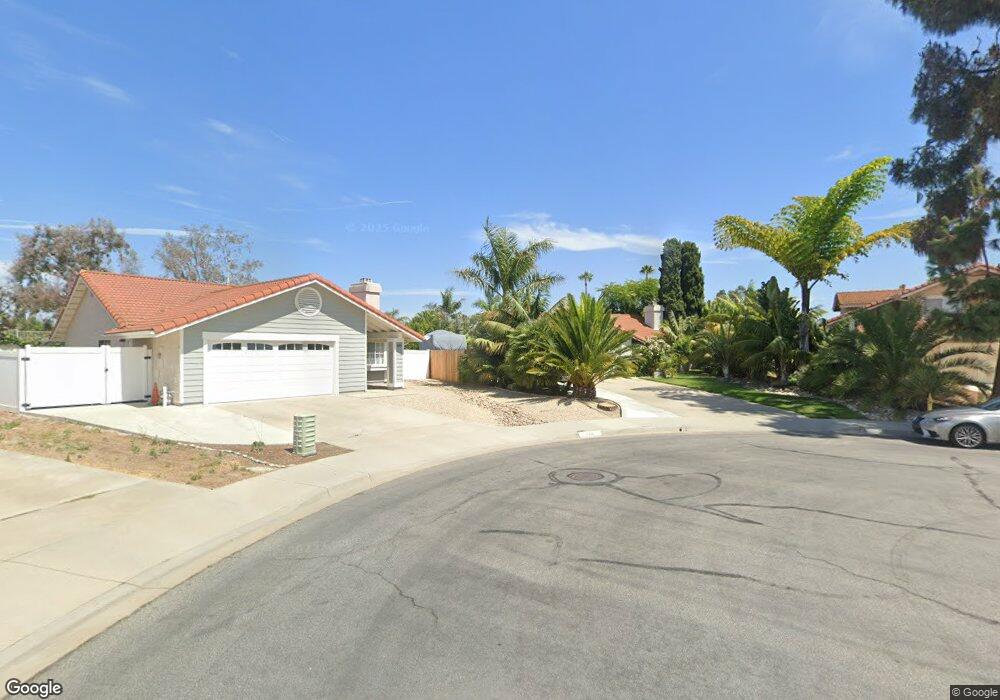
688 Wolf Point Ct Oceanside, CA 92057
Guajome NeighborhoodEstimated Value: $929,000 - $969,695
4
Beds
2
Baths
1,639
Sq Ft
$582/Sq Ft
Est. Value
About This Home
This home is located at 688 Wolf Point Ct, Oceanside, CA 92057 and is currently estimated at $954,674, approximately $582 per square foot. 688 Wolf Point Ct is a home located in San Diego County with nearby schools including Alamosa Park Elementary School, Roosevelt Middle School, and Vista High School.
Ownership History
Date
Name
Owned For
Owner Type
Purchase Details
Closed on
Oct 5, 2017
Sold by
Spangler Allan R
Bought by
Mcleod Mathew and Mcleod Ariel
Current Estimated Value
Home Financials for this Owner
Home Financials are based on the most recent Mortgage that was taken out on this home.
Original Mortgage
$510,581
Outstanding Balance
$426,021
Interest Rate
3.78%
Mortgage Type
FHA
Estimated Equity
$528,653
Purchase Details
Closed on
Aug 15, 2012
Sold by
Spangler Allan R
Bought by
Spangler Allan R
Home Financials for this Owner
Home Financials are based on the most recent Mortgage that was taken out on this home.
Original Mortgage
$195,600
Interest Rate
3.53%
Mortgage Type
New Conventional
Purchase Details
Closed on
Dec 10, 2000
Sold by
Spangler Geraldine Y
Bought by
Spangler Allan R
Purchase Details
Closed on
Aug 29, 1994
Sold by
Andersen Hans Erik and Andersen Carrie Michelle
Bought by
Spangler Allan R and Spangler Geraldine Y
Home Financials for this Owner
Home Financials are based on the most recent Mortgage that was taken out on this home.
Original Mortgage
$166,260
Interest Rate
8.57%
Mortgage Type
VA
Purchase Details
Closed on
Aug 23, 1988
Create a Home Valuation Report for This Property
The Home Valuation Report is an in-depth analysis detailing your home's value as well as a comparison with similar homes in the area
Home Values in the Area
Average Home Value in this Area
Purchase History
| Date | Buyer | Sale Price | Title Company |
|---|---|---|---|
| Mcleod Mathew | $520,000 | Fidelity National Title | |
| Spangler Allan R | -- | Fidelity National Title Co | |
| Spangler Allan R | -- | -- | |
| Spangler Allan R | $168,000 | Guardian Title Company | |
| -- | $126,500 | -- |
Source: Public Records
Mortgage History
| Date | Status | Borrower | Loan Amount |
|---|---|---|---|
| Open | Mcleod Mathew | $510,581 | |
| Previous Owner | Spangler Allan R | $195,600 | |
| Previous Owner | Spangler Allan R | $166,260 |
Source: Public Records
Tax History Compared to Growth
Tax History
| Year | Tax Paid | Tax Assessment Tax Assessment Total Assessment is a certain percentage of the fair market value that is determined by local assessors to be the total taxable value of land and additions on the property. | Land | Improvement |
|---|---|---|---|---|
| 2025 | $6,515 | $591,666 | $184,990 | $406,676 |
| 2024 | $6,515 | $580,065 | $181,363 | $398,702 |
| 2023 | $6,363 | $568,692 | $177,807 | $390,885 |
| 2022 | $6,347 | $557,542 | $174,321 | $383,221 |
| 2021 | $6,209 | $546,610 | $170,903 | $375,707 |
| 2020 | $6,189 | $541,006 | $169,151 | $371,855 |
| 2019 | $6,100 | $530,399 | $165,835 | $364,564 |
| 2018 | $5,806 | $520,000 | $162,584 | $357,416 |
| 2017 | $2,754 | $243,126 | $76,016 | $167,110 |
| 2016 | $2,691 | $238,360 | $74,526 | $163,834 |
| 2015 | $2,680 | $234,781 | $73,407 | $161,374 |
| 2014 | $2,617 | $230,183 | $71,970 | $158,213 |
Source: Public Records
Map
Nearby Homes
- 5005 Codorniz Way Unit 8
- 5241 Alamosa Park Dr
- 5202 Via Tizon
- 5166 Via Portola
- 872 Oro Grande St
- 5516 Giovanni Way
- 358 Via Metates
- 652 Montage Rd
- 5334 Rio Plata Dr
- 635 Boysenberry Way
- 5349 Gooseberry Way
- 838 Masters Dr
- 5063 Frazee Rd
- 104 Mellano Way
- 4884 Tarragon Dr
- 103 Arlow Way
- 110 Takamasa Way
- 114 Mellano Way
- 111 Metz Way
- 108 Metz Way
- 684 Wolf Point Ct
- 692 Wolf Point Ct
- 687 Picacho Ct
- 693 Picacho Ct
- 5085 Caspian Dr
- 696 Wolf Point Ct
- 683 Wolf Point Ct
- 5090 Caspian Dr
- 5094 Caspian Dr
- 697 Picacho Ct
- 683 Picacho Ct
- 5086 Caspian Dr
- 5081 Caspian Dr
- 693 Wolf Point Ct
- 5082 Caspian Dr
- 767 Cuchillo St
- 5078 Caspian Dr
- 682 Picacho Ct
- 5236 Silver Bluff Dr
- 5098 Caspian Dr