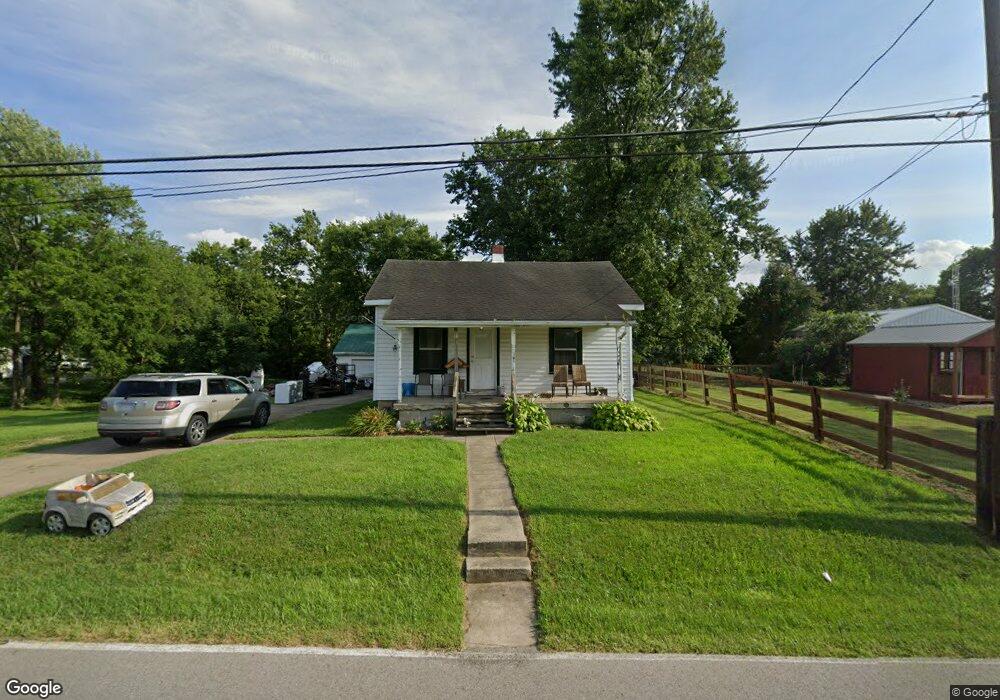
6881 Michael Rd Middletown, OH 45042
Estimated Value: $218,000 - $228,125
2
Beds
1
Bath
1,092
Sq Ft
$205/Sq Ft
Est. Value
About This Home
This home is located at 6881 Michael Rd, Middletown, OH 45042 and is currently estimated at $223,531, approximately $204 per square foot. 6881 Michael Rd is a home located in Butler County with nearby schools including Madison High School.
Ownership History
Date
Name
Owned For
Owner Type
Purchase Details
Closed on
Feb 3, 2025
Sold by
Fose Zachary D and Fose Zachery D
Bought by
Fose Ronald R and Fose Mary M
Current Estimated Value
Purchase Details
Closed on
Nov 9, 2016
Sold by
Fose Ronald R and Fose Mary M
Bought by
Fose Zachery D
Home Financials for this Owner
Home Financials are based on the most recent Mortgage that was taken out on this home.
Original Mortgage
$70,000
Interest Rate
3.52%
Mortgage Type
Purchase Money Mortgage
Purchase Details
Closed on
Oct 6, 2016
Sold by
Murphy Kathaleen F
Bought by
Fose Ronald R and Fose Mary M
Home Financials for this Owner
Home Financials are based on the most recent Mortgage that was taken out on this home.
Original Mortgage
$70,000
Interest Rate
3.52%
Mortgage Type
Purchase Money Mortgage
Purchase Details
Closed on
Apr 23, 2002
Sold by
Estate Of Woodrow Murphy
Bought by
Murphy Kathaleen F and Murphy Kathaleen
Create a Home Valuation Report for This Property
The Home Valuation Report is an in-depth analysis detailing your home's value as well as a comparison with similar homes in the area
Home Values in the Area
Average Home Value in this Area
Purchase History
| Date | Buyer | Sale Price | Title Company |
|---|---|---|---|
| Fose Ronald R | -- | None Listed On Document | |
| Fose Ronald R | -- | None Listed On Document | |
| Fose Zachery D | $70,000 | None Available | |
| Fose Ronald R | $70,000 | None Available | |
| Murphy Kathaleen F | -- | -- |
Source: Public Records
Mortgage History
| Date | Status | Borrower | Loan Amount |
|---|---|---|---|
| Previous Owner | Fose Zachery D | $70,000 |
Source: Public Records
Tax History
| Year | Tax Paid | Tax Assessment Tax Assessment Total Assessment is a certain percentage of the fair market value that is determined by local assessors to be the total taxable value of land and additions on the property. | Land | Improvement |
|---|---|---|---|---|
| 2025 | $2,368 | $57,180 | $15,790 | $41,390 |
| 2024 | $2,368 | $57,180 | $15,790 | $41,390 |
| 2023 | $2,334 | $57,180 | $15,790 | $41,390 |
| 2022 | $1,935 | $41,170 | $15,790 | $25,380 |
| 2021 | $1,741 | $41,170 | $15,790 | $25,380 |
| 2020 | $1,811 | $41,170 | $15,790 | $25,380 |
| 2019 | $1,734 | $29,940 | $15,790 | $14,150 |
| 2018 | $1,426 | $29,940 | $15,790 | $14,150 |
| 2017 | $1,425 | $29,940 | $15,790 | $14,150 |
| 2016 | $950 | $27,970 | $15,790 | $12,180 |
| 2015 | $481 | $27,970 | $15,790 | $12,180 |
| 2014 | $711 | $27,970 | $15,790 | $12,180 |
| 2013 | $711 | $37,700 | $15,790 | $21,910 |
Source: Public Records
Map
Nearby Homes
- 6429 Diver Ln
- 5750 Trenton Franklin Rd
- 5800 Trenton Franklin Rd
- 881 Middletown Eaton Rd
- 489 Emerson Rd
- 1690 Middletown Eaton Rd
- 640 Hill St
- 1675 Middletown Eaton Rd
- 6853 Cloister Cliffs Dr
- 6610 Sloebig Rd
- 429 Leichty Ave
- 433 Leichty Ave
- 6308 Elk Creek Rd
- 7131 Elk Creek Rd
- 0 Middletown Eaton Rd Unit 952258
- 0 Middletown Eaton Rd Unit 1868870
- 8469 Corlee Rd
- 2307 Middletown Eaton Rd
- 8030 Thomas Rd
- 50 S Main St
- 6861 Michael Rd
- 6895 Michael Rd
- 429 Michael Rd
- 6835 Michael Rd
- 6823 Michael Rd
- 6858 Michael Rd
- 6817 Michael Rd
- 6919 Michael Rd
- 6892 Michael Rd
- 6846 Michael Rd
- 6829 Michael Rd
- 6952 Michael Rd
- 6939 Michael Rd
- 6960 Michael Rd
- 6945 Michael Rd
- 6949 Michael Rd
- 6984 Michael Rd
- 6827 Michael Rd
- 7006 Michael Rd
- 6941 Michael Rd
Your Personal Tour Guide
Ask me questions while you tour the home.