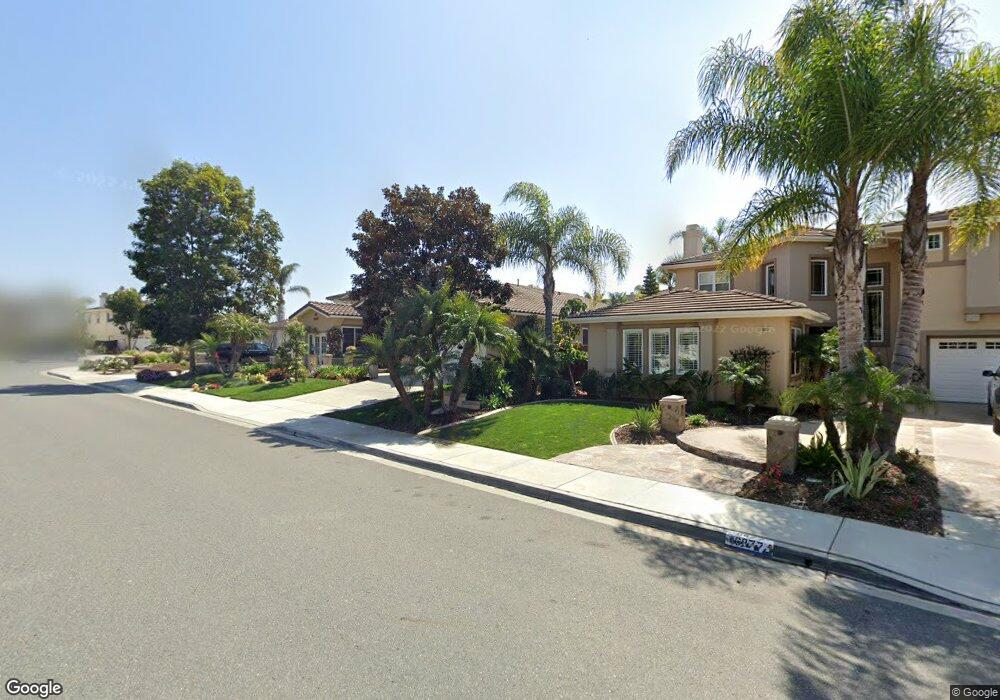
6881 Mimosa Dr Carlsbad, CA 92011
Poinsettia NeighborhoodEstimated Value: $1,771,768 - $2,078,000
3
Beds
3
Baths
2,409
Sq Ft
$812/Sq Ft
Est. Value
About This Home
This home is located at 6881 Mimosa Dr, Carlsbad, CA 92011 and is currently estimated at $1,956,942, approximately $812 per square foot. 6881 Mimosa Dr is a home located in San Diego County with nearby schools including Aviara Oaks Elementary, Aviara Oaks Middle, and Sage Creek High.
Ownership History
Date
Name
Owned For
Owner Type
Purchase Details
Closed on
May 15, 2019
Sold by
Johnson Edward and Johnson Freda
Bought by
Johnson Living Trust
Current Estimated Value
Purchase Details
Closed on
Sep 10, 2003
Sold by
Mar Elia Darren E and Hanson Karen J
Bought by
Johnson Edward and Johnson Freda
Purchase Details
Closed on
Sep 5, 2002
Sold by
Toltzman Robert J and Toltzman Margaret A
Bought by
Mar Elia Darren E and Hanson Karen J
Home Financials for this Owner
Home Financials are based on the most recent Mortgage that was taken out on this home.
Original Mortgage
$520,000
Interest Rate
5%
Purchase Details
Closed on
Feb 22, 2000
Sold by
Western Pacific Housing El Camino Llc
Bought by
Toltzman Robert J and Toltzman Margaret A
Home Financials for this Owner
Home Financials are based on the most recent Mortgage that was taken out on this home.
Original Mortgage
$325,850
Interest Rate
2.5%
Create a Home Valuation Report for This Property
The Home Valuation Report is an in-depth analysis detailing your home's value as well as a comparison with similar homes in the area
Home Values in the Area
Average Home Value in this Area
Purchase History
| Date | Buyer | Sale Price | Title Company |
|---|---|---|---|
| Johnson Living Trust | -- | None Available | |
| Johnson Edward | $700,000 | First American Title | |
| Mar Elia Darren E | $650,000 | Equity Title Company | |
| Toltzman Robert J | $407,500 | First American Title |
Source: Public Records
Mortgage History
| Date | Status | Borrower | Loan Amount |
|---|---|---|---|
| Previous Owner | Mar Elia Darren E | $520,000 | |
| Previous Owner | Toltzman Robert J | $325,850 | |
| Closed | Mar Elia Darren E | $65,000 |
Source: Public Records
Tax History Compared to Growth
Tax History
| Year | Tax Paid | Tax Assessment Tax Assessment Total Assessment is a certain percentage of the fair market value that is determined by local assessors to be the total taxable value of land and additions on the property. | Land | Improvement |
|---|---|---|---|---|
| 2025 | $11,143 | $995,213 | $568,693 | $426,520 |
| 2024 | $11,143 | $975,700 | $557,543 | $418,157 |
| 2023 | $11,089 | $956,569 | $546,611 | $409,958 |
| 2022 | $10,929 | $937,814 | $535,894 | $401,920 |
| 2021 | $10,851 | $919,427 | $525,387 | $394,040 |
| 2020 | $10,783 | $910,000 | $520,000 | $390,000 |
| 2019 | $10,601 | $892,157 | $509,804 | $382,353 |
| 2018 | $10,184 | $874,664 | $499,808 | $374,856 |
| 2017 | $92 | $857,514 | $490,008 | $367,506 |
| 2016 | $8,801 | $760,000 | $432,000 | $328,000 |
| 2015 | $9,211 | $790,000 | $450,000 | $340,000 |
| 2014 | $9,234 | $790,000 | $450,000 | $340,000 |
Source: Public Records
Map
Nearby Homes
- 1845 Cliff Swallow Ln
- 1738 Oriole Ct
- 6903 Quail Place
- 6907 Quail Place Unit F
- 6911 Quail Place Unit C
- 7012 Goldenrod Way
- 6901 Tourmaline Place
- 7022 Ibis Place
- 1980 Marcasite Place
- 1933 Alga Rd Unit C
- 1913 Alga Rd Unit A
- 7019 Estrella de Mar Rd
- 7021 Estrella de Mar Rd
- 7115 Manzanita St
- 1736 Blackbird Cir
- 7026 Estrella de Mar Rd
- 7212 Columbine Dr
- 6438 Lilium Ln
- 6377 Alexandri Cir
- 6325 Alexandri Cir
- 6877 Mimosa Dr
- 6885 Mimosa Dr
- 6907 Blue Orchid Ln
- 6873 Mimosa Dr
- 6913 Blue Orchid Ln
- 6903 Blue Orchid Ln
- 6917 Blue Orchid Ln
- 6878 Mimosa Dr
- 6882 Mimosa Dr
- 6874 Mimosa Dr
- 6869 Mimosa Dr
- 6923 Blue Orchid Ln
- 6886 Mimosa Dr
- 6898 Mimosa Dr
- 6894 Mimosa Dr
- 6870 Mimosa Dr
- 6865 Mimosa Dr
- 6890 Mimosa Dr
- 6902 Mimosa Dr
- 6927 Blue Orchid Ln