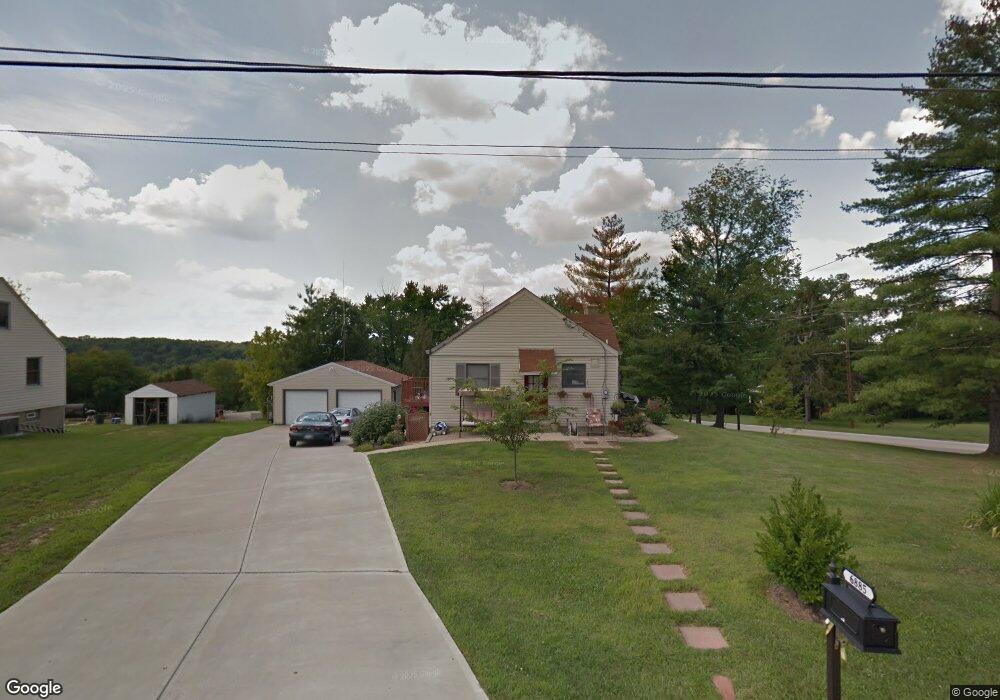
6885 Kern Dr Cincinnati, OH 45247
Estimated Value: $177,000 - $240,000
2
Beds
1
Bath
714
Sq Ft
$284/Sq Ft
Est. Value
About This Home
This home is located at 6885 Kern Dr, Cincinnati, OH 45247 and is currently estimated at $202,519, approximately $283 per square foot. 6885 Kern Dr is a home located in Hamilton County with nearby schools including Colerain Elementary School, Colerain Middle School, and Colerain High School.
Ownership History
Date
Name
Owned For
Owner Type
Purchase Details
Closed on
Jun 19, 2023
Sold by
Huff Joann and Huff Nelson
Bought by
Huff Joann and Huff Nelson
Current Estimated Value
Purchase Details
Closed on
Aug 25, 2018
Sold by
Huff Joann and Huff Nelson
Bought by
Huff Joann and Huff Nelson
Home Financials for this Owner
Home Financials are based on the most recent Mortgage that was taken out on this home.
Original Mortgage
$76,000
Interest Rate
4.5%
Mortgage Type
New Conventional
Purchase Details
Closed on
Sep 13, 1999
Sold by
Perkins Marc A and Perkins Marc C
Bought by
Hubbard Joann
Home Financials for this Owner
Home Financials are based on the most recent Mortgage that was taken out on this home.
Original Mortgage
$69,600
Interest Rate
8.21%
Mortgage Type
Balloon
Create a Home Valuation Report for This Property
The Home Valuation Report is an in-depth analysis detailing your home's value as well as a comparison with similar homes in the area
Home Values in the Area
Average Home Value in this Area
Purchase History
| Date | Buyer | Sale Price | Title Company |
|---|---|---|---|
| Huff Joann | -- | None Listed On Document | |
| Huff Joann | -- | Carrington Title Services Ll | |
| Hubbard Joann | $87,000 | Titlequest Agency Inc |
Source: Public Records
Mortgage History
| Date | Status | Borrower | Loan Amount |
|---|---|---|---|
| Previous Owner | Huff Joann | $76,000 | |
| Previous Owner | Hubbard Joann | $69,600 | |
| Closed | Hubbard Joann | $17,400 |
Source: Public Records
Tax History Compared to Growth
Tax History
| Year | Tax Paid | Tax Assessment Tax Assessment Total Assessment is a certain percentage of the fair market value that is determined by local assessors to be the total taxable value of land and additions on the property. | Land | Improvement |
|---|---|---|---|---|
| 2024 | $3,980 | $56,609 | $14,000 | $42,609 |
| 2023 | $3,993 | $56,609 | $14,000 | $42,609 |
| 2022 | $3,842 | $43,904 | $16,520 | $27,384 |
| 2021 | $2,887 | $42,476 | $16,520 | $25,956 |
| 2020 | $2,817 | $42,476 | $16,520 | $25,956 |
| 2019 | $2,562 | $35,998 | $14,000 | $21,998 |
| 2018 | $2,299 | $35,998 | $14,000 | $21,998 |
| 2017 | $2,183 | $35,998 | $14,000 | $21,998 |
| 2016 | $2,258 | $36,754 | $13,965 | $22,789 |
| 2015 | $2,276 | $36,754 | $13,965 | $22,789 |
| 2014 | $2,280 | $36,754 | $13,965 | $22,789 |
| 2013 | $2,284 | $38,689 | $14,700 | $23,989 |
Source: Public Records
Map
Nearby Homes
- 6994 Mullen Rd
- 7146 Althaus Rd
- 7212 Creekview Dr
- 7298 Harrison Ave
- 7234 Creekview Dr
- 8434 Forest Valley Dr
- 7238 Creekview Dr
- 7240 Creekview Dr
- 6433 Springdale Rd
- 6384 Conifer Ln
- 5891 Snyder Rd
- 6765 Verde Ridge Dr Unit 20C
- 6662 Daleview Rd
- 8060 Bridge Point Dr
- 7979 Oakbridge Way
- 6676 Daleview Rd
- 6761 Schweitzerhoff Rd
- 6998 Harrison Ave
- 7843 Bridge Point Dr
- 7787 Skyview Cir
- 6863 Kern Dr
- 6970 Springdale Rd
- 6868 Kern Dr
- 6971 Springdale Rd
- 6924 Springdale Rd
- 6888 Kern Dr
- 6858 Kern Dr
- 6848 Kern Dr
- 6841 Kern Dr
- 6989 Springdale Rd
- 6759 Kern Dr Unit 26
- 6988 Springdale Rd
- 6824 Kern Dr
- 6885 Springdale Rd
- 6831 Kern Dr
- 6900 Springdale Rd
- 7012 Springdale Rd
- 7011 Springdale Rd
- 6836 Kern Dr
- 6821 Kern Dr